Figure 5.
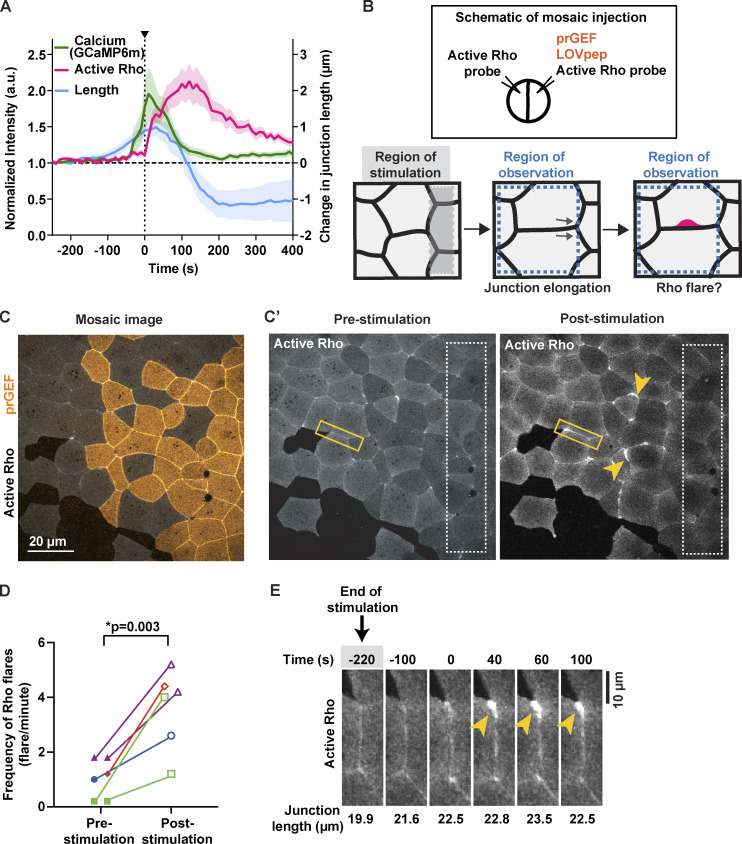
Junction elongation induces Rho flares. (A) Graph showing that calcium flash (GCaMP6m) follows junction elongation (verted-to-vertex length) and precedes Rho-mediated junction contraction and stabilization of length. Time 0 s represents start of Rho flare. Shaded region represents SEM; n = 16 flares, 13 embryos, 10 experiments. (B) Schematic of mosaic injection and regional activation of Rho-mediated contractility using optogenetics. Top: Schematic showing the mosaic injection of optogenetic constructs (prGEF and LOVpep) injected into one cell, while active Rho probe is injected in both cells at two-cell stage. Bottom: Regional activation of RhoA using optogenetics in region of stimulation (shaded gray box) and quantification of junction length and frequency of Rho flares in region of observation (dotted blue box). (C) Cell view of an embryo mosaically-expressing prGEF (2xPDZ-YFP-LARG(DH), yellow) and active Rho probe (mCherry-2xrGBD, gray). (C′) Cell view of Rho probe in the embryo from C. Regional stimulation (white dashed box) induces Rho flares in areas neighboring the region of stimulation (yellow arrowheads). (D) Quantification of Rho flares in the area outside the region of stimulation shown in C′. Frequency of Rho flares occurring pre-stimulation (0–300 s) and post-stimulation (600–900 s) are matched for color and shape. Significance calculated using unpaired two-tailed t test; n = 6 embryos, 4 experiments. (E) Time-lapse montage of a junction highlighted in C′ (yellow box) expressing active Rho probe (mCherry-2xrGBD). Following optogenetic stimulation (indicated by gray shaded box), an increase in junction length precedes Rho flare activation (yellow arrowhead). Junction length measured from vertex to vertex is indicated under each panel.

