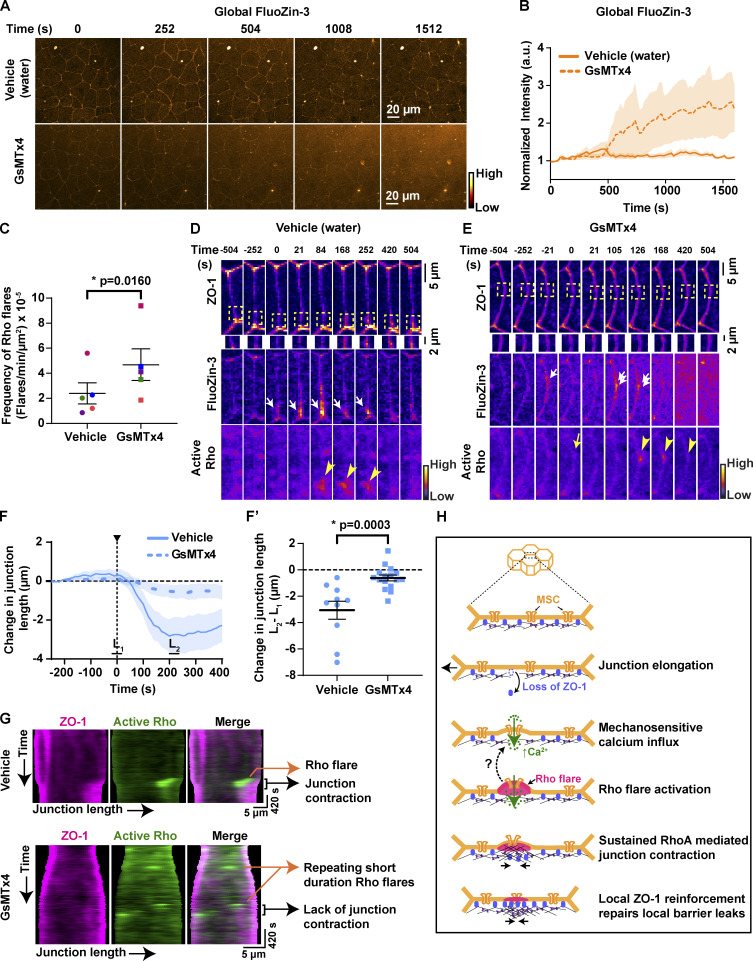
Figure 7.
MSC-mediated calcium influx is critical for epithelial barrier function and local junction contraction. (A) Time-lapse images (orange hot LUT) of epithelial permeability tested using ZnUMBA (FluoZin-3). Embryos were treated with water (vehicle, top) or 12.5 µM GsMTx4 (MSC inhibitor, bottom). Time 0 s represents the start of the time-lapse movie. (B) Graph of mean normalized intensity of whole-field FluoZin-3 for vehicle (water) or GsMTx4-treated embryos. Blocking MSCs increased global FluoZin-3 intensity over time compared with vehicle. Shaded region represents SEM. Vehicle: n = 6 embryos, 4 experiments; GsMTx4: n = 6 embryos, 4 experiments. (C) Frequency of Rho flares in vehicle- (water) and GsMTx4-treated embryos. Frequencies from paired experiments are color matched. Error bars represent mean ± SEM; significance calculated using paired two-tailed t test; n = 5 embryos, 4 experiments. (D and E) Montage of representative junctions from A (FIRE LUT). Blocking MSCs with GsMTx4 causes repeated increases in local FluoZin-3 (white arrows), reduced ZO-1 (BFP-ZO-1) reinforcement (yellow boxes, enlarged below), and reduced duration of Rho flares (mCherry-2xrGBD, yellow arrowheads) at sites of ZO-1 loss. Repeated FluoZin-3 increase is indicated by double white arrows, and failure to activate Rho flare after FluoZin-3 increase is indicated by yellow arrow. (F and F′) Graph of change in junction length for junctions with Rho flares in vehicle- (water) and GsMTx4-treated embryos. Shaded region represents SEM. (F′) Scatter plot of change in junction length was calculated from F. L1 and L2 represent average length of junction from individual traces from times −20 to 20 s and 200–240 s, respectively. Error bars represent mean ± SEM; significance calculated using Mann–Whitney U test. Vehicle: n = 10 flares, 6 embryos, 6 experiments; GsMTx4: n = 16 flares, 7 embryos, 6 experiments. (G) Kymographs of BFP-ZO-1 (magenta) and active Rho (mChe-2xrGBD, green) from representative junctions projected vertex to vertex over time for vehicle- (water) and GsMTx4-treated embryos. Kymographs highlight the repeating, short-duration Rho flares, loss of local junction contraction, and reduced ZO-1 reinforcement upon GsMTx4 treatment. (H) Model showing mechanism by which mechanosensitive calcium signaling regulates epithelial barrier function. Top: 3D view of epithelial cells. Bottom: En face view of the junction highlighted showing our model of the local calcium and RhoA signaling following mechanical stimuli. Dotted arrow indicates a possible positive feedback mechanism where active RhoA-mediated membrane protrusion regulates MSC-dependent calcium influx at the site of ZO-1 repair, thus helping to sustain local Rho activation.

