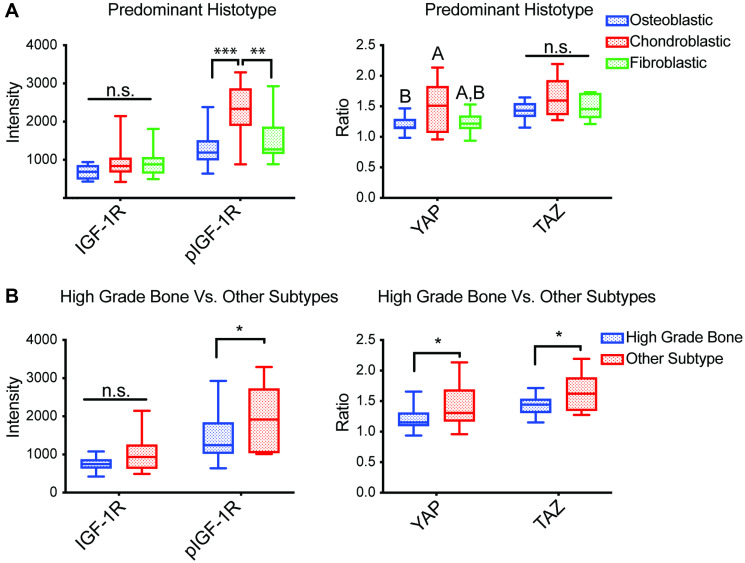
Figure 2. Associations between TMA staining and histopathological aspects of tumors.
Average mean nuclear intensity of IGF-1R and pIGF-1R (Y1161) (n = 37) and average N:C ratio of YAP and TAZ (n = 36) in biopsies represented in a TMA subdivided by (A) predominant histotype of constituent cells [fibroblastic n = 10; osteoblastic n = 14; chondroblastic n = 7; other n = 4; not listed = 2], and (B) osteosarcoma subtypes compared to the high grade bone subtype [high-grade bone n = 27; other n = 10]. Box plots with inner line represent the interquartile range and median, where whiskers represent the range of observed values; Abbreviation: n.s.: no significance, differing letters and * p < 0.05, ** p < 0.01, *** p < 0.001, ANOVA with post-hoc Sidak test.

