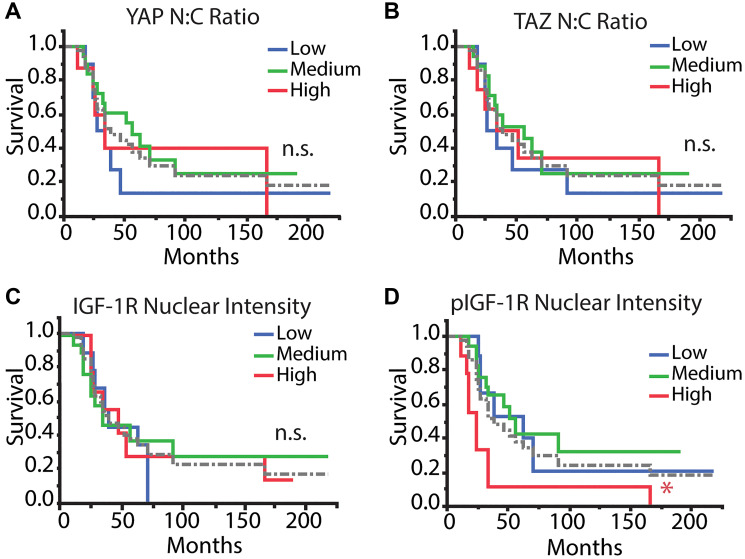
Figure 3. Kaplan–Meier survival analysis of tumor markers.
Patients were stratified into low, medium, and high categories (1st quartile [n = 10 IGF-1R/pIGF-1R; n = 9 YAP/TAZ], interquartile range [n = 17 IGF-1R/pIGF-1R; n = 18 YAP/TAZ], 4th quartile [n = 10 IGF-1R/pIGF-1R; n = 9 YAP/TAZ] for each mean value across all patients, respectively) for each parameter and were analyzed with Kaplan–Meier analysis to determine differences in overall survival. Tumor markers included (A) YAP N:C ratio, (B) TAZ N:C ratio, (C) IGF-1R nuclear intensity, and (D) pIGF-1R nuclear intensity. The dotted gray line refers to the average of all patients. Log-rank test, post-hoc: Abbreviation: n.s.: no significance, * p < 0.05, ** p < 0.01.

