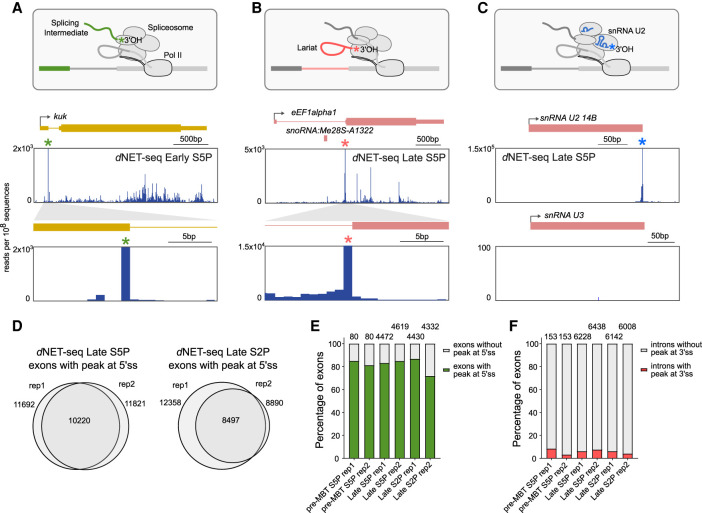
FIGURE 2.
dNET-seq captures splicing intermediates and spliceosomal snRNAs. (A–C) The diagrams outline the 3′ OH ends generated by cotranscriptional cleavage at the 5′ splice site (A), the 3′ splice site (B), and the free 3′ OH end of spliceosomal snRNAs (C). Below each diagram, dNET-seq/S5P profiles over the indicated genes are depicted (data from late embryos). The green asterisk denotes the peak at the end of the exon (A). The pink asterisk denotes the peak at the end of the intron (B). The blue asterisk denotes the peak at the end of the U2 snRNA gene (C). Arrows indicate the direction of transcription. Exons are represented by boxes. Thinner boxes represent UTRs. Introns are represented by lines connecting the exons. (D) Comparison (Venn diagrams) of exons with a splicing intermediate peak detected in biological replicates of dNET-seq/S5P and dNET-seq/S2P libraries. (E,F) Frequency of peaks corresponding to splicing intermediates (E) and released intron lariats (F) in pre-MBT genes and genes expressed in late embryos. Only genes with the highest read density (fourth quartile) were considered.

