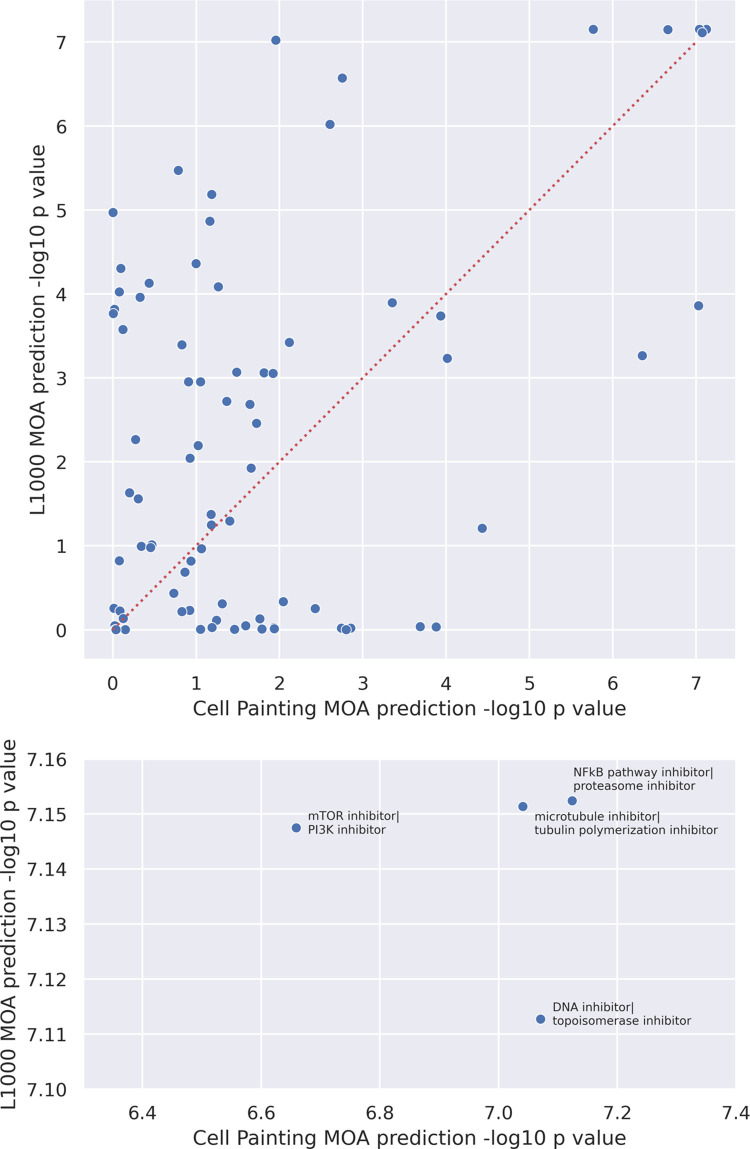
Fig 5. Scatterplot of L1000 vs Cell Painting MOA performance for MMD-VAE, with outliers (>3 stds) excluded.
Performance is determined by the test scores between the L2 distance between predicted and real profile and the distribution of L2 distances from shuffling MOAs 10 times. Top—all “A ∩ B” combinations; bottom—only the top 5 “A ∩ B” with labels.

