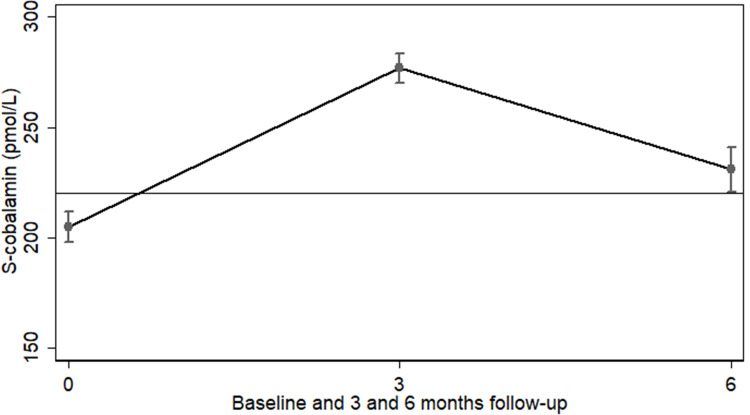
Fig 2. SC during and after supplementation.
Mean (95% CI) SC at baseline (n = 1,192), after 3 months supplementation (n = 1,330), and after an additional 3 months without supplementation (n = 398). Based on mixed-effects tobit regression and adjusted for age, sex, months of admission, site and baseline values of MUAC, WLZ, and LAZ, serum CRP, inflammation and morbidity, and baseline SC. Horizontal line at 222 pmol/L indicates cutoff to define normal SC. CRP, C-reactive protein; LAZ, length-for-age z-score; MUAC, mid-upper arm circumference; SC, serum cobalamin; WLZ, weight-for-length z-score.

