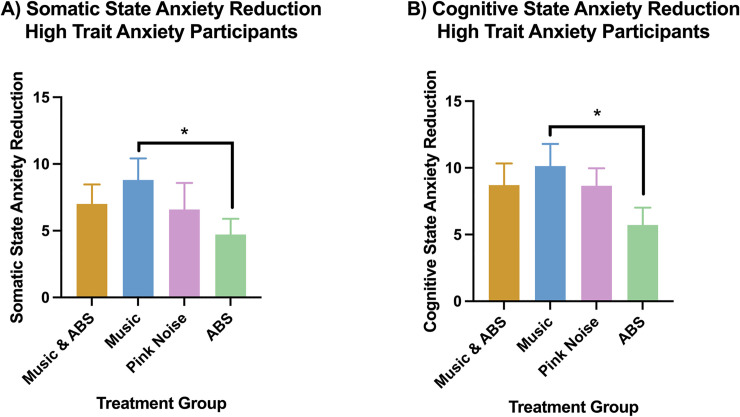
Fig 3.
Mean somatic (A) and cognitive (B) state anxiety reduction in high trait anxiety participants. * Indicates p < 0.05 (FRT, 5000 iterations). Error bars are standard deviations. Please see Table 4A and 4B below for exact p values, tail of test, effect sizes, power and degrees of freedom for each significant comparison.

