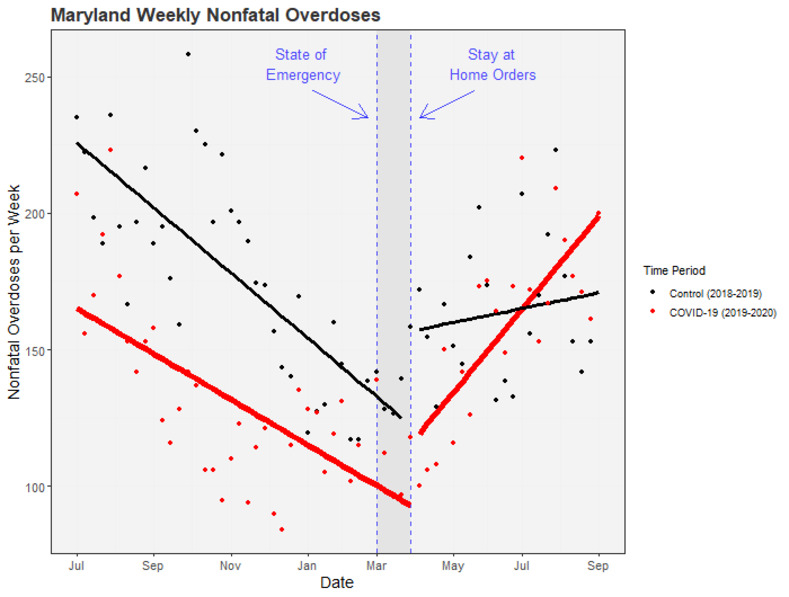
Fig 2. ITS adjusted weekly nonfatal overdose counts in Maryland state pre- and post-Covid-19 public health orders.

Points represent weekly counts of suspected nonfatal overdoses. Solid lines represent ITS-model-predicted counts: red for the Covid-19 time series (including March 2020), black for the preceding time series (including March 2019). Dashed horizontal lines mark the official declaration of a state of emergency (March 5th, 2020) and stay-at-home orders (March 30th, 2020) in Maryland state.
