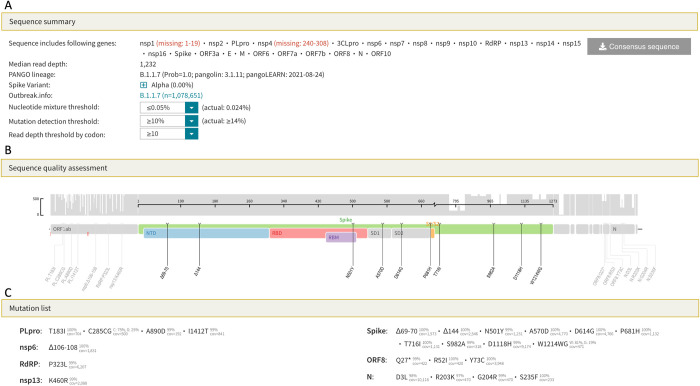
Fig 6. SARS-CoV-2 sequence analysis program output for FASTQ sequences or codon frequency tables.
The sequence summary section (A) lists the genes that were sequenced, the median read depth, and the PANGO lineage. This section also contains dropdown boxes that enable the user to select the minimum number and proportion of reads, respectively, required to identify a mutation. The threshold that minimizes the proportion of positions with nucleotide ambiguities can also be selected. The sequence quality assessment section displays the read depth across the genome and lists only those amino acid mutations that meet the user-defined criteria specified in the sequence summary section (B). The mutation list section lists those amino acid mutations that meet the user-defined criteria and shows the proportion of reads containing the mutation (C). The output shown in this figure can be regenerated by loading the example file B.1.1.7 (ERR5026962) at this URL: https://covdb.stanford.edu/sierra/sars2/by-reads/.

