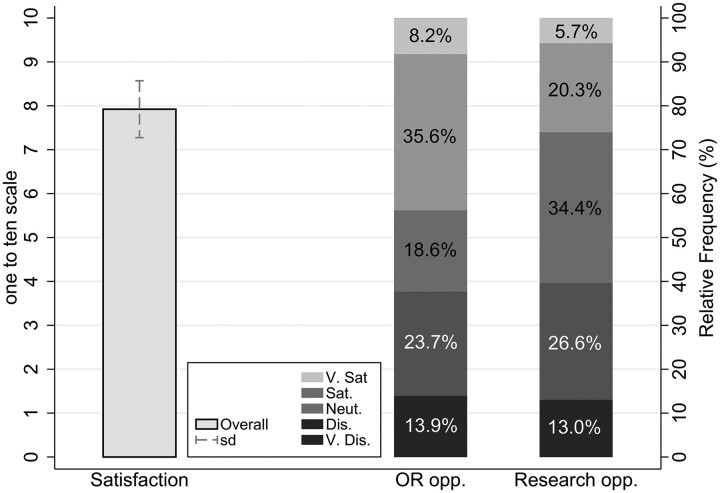
Figure 2:
Satisfaction among surveyed residents. Left-hand side column shows overall satisfaction expressed on a scale of 1–10. Right-hand side columns depict stacked relative frequencies of satisfaction ranks on a five-point scale for OR exposure and research designated time. Dis.: dissatisfied; Neut.: neutral; opp., opportunity; OR: operating room; SD: standard deviation; Sat.: satisfied; V.: very.

