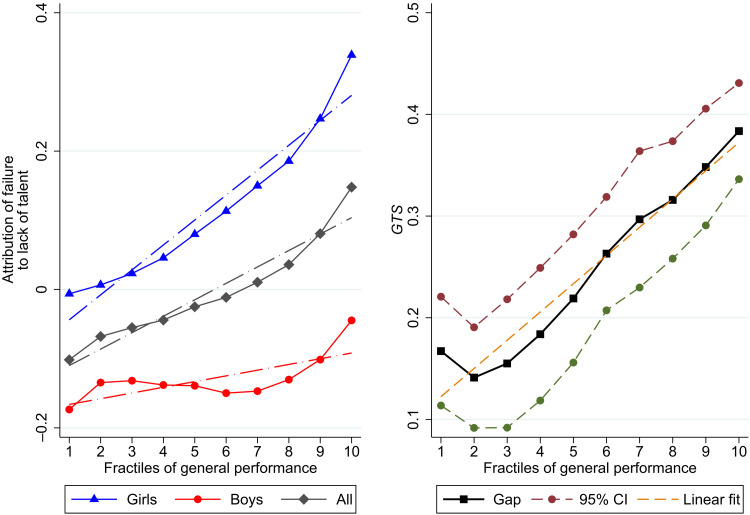
Fig. 2. Girls’ and boys’ attribution of failure to lack of talent and their difference (GTS) as a function of their ability.
Analyses based on a sample of 73 countries and more than 500,000 observations. The left figure shows the mean levels of perceived lack of talent for boys (red), for girls (blue), and for all (black) by deciles of general performance. The right figure shows the difference between girls’ and boys’ level of perceived lack of talent, i.e., gender-talent stereotypes (GTS) in each decile of general performance, as well as the associated 95% confidence intervals (CI). Perceived lack of talent is based on students’ answers to PISA item about their attribution of failure to lack of talent and is standardized at the country level. General performance is the unweighted mean of performance in math, reading, and science. It is standardized to have a weighted mean equal to zero and a weighted SD equal to one in each country in the sample. It is then split in deciles. The variables are described in detail in Supplementary Appendix A. Estimates and SEs involving measures of ability are based on plausible values and account for measurement error in these abilities on top of standard sampling error (see details in Supplementary Appendix B).

