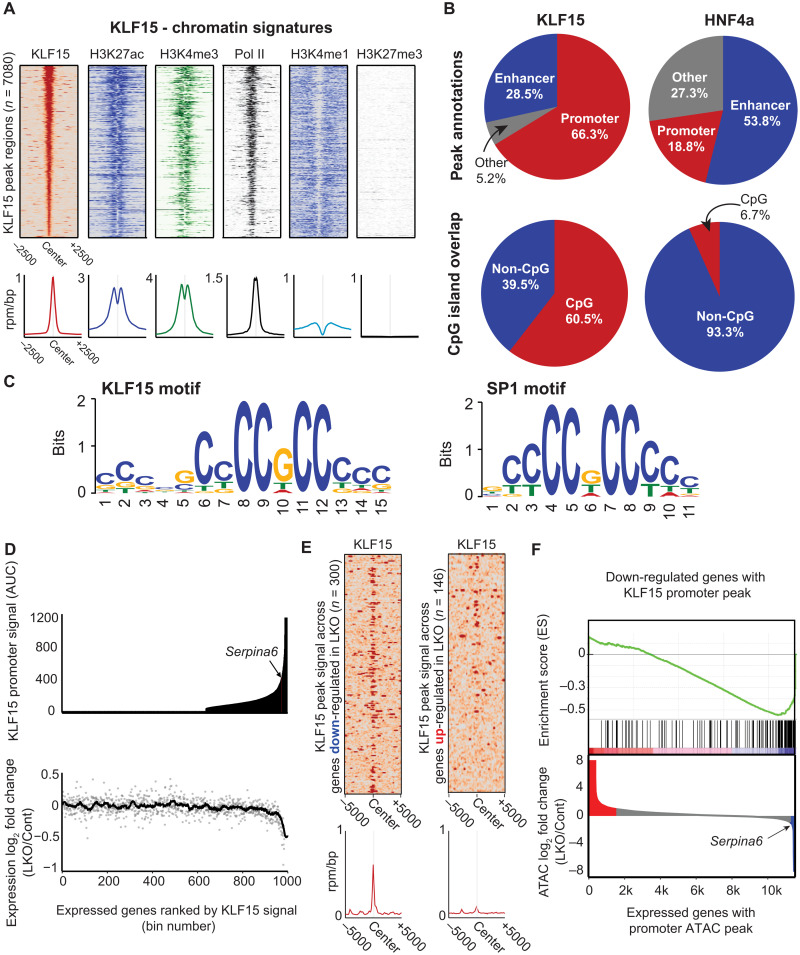
Fig. 3. Genome-wide analyses reveal that liver KLF15 is predominantly promoter bound, where it opens the chromatin and functions as a transactivator.
(A) Heatmaps of KLF15, H3K27ac, H3K4me3, RNA Pol II, H3K4me1, and H3K27ac ChIP-seq signal (rpm/bp) along 5-kb regions centered at KLF15 peaks. Regions are ordered on the basis of the KLF15 transcription factor peak signal (highest to lowest). Average signal profile (rpm/bp) is plotted below each heatmap. (B) Top row: Peak annotations for KLF15 (left) and HNF4a (right). Promoter peaks are defined as those falling within 2 kb of a known TSS, while enhancer peaks are defined as nonpromoter peaks overlapping a high-confidence region of H3K27ac. Bottom row: Proportion of overlap between KLF15 peaks (left) and HNF4a peaks (right) with known CpG islands. (C) Top motif identified from sequences within KLF15 peak regions (left; E = 7.6 × 10−109). Known SP1 motif is shown on the right. (D) Top: Median KLF15 ChIP-seq signal over TSSs for expressed genes subdivided into 1000 bins and rank ordered by KLF15 TSS signal. Bottom: Median log2 fold change (KLF15-LKO/control) for genes within each bin. (E) Heatmap of KLF15 ChIP-seq signal ±5 kb around the TSS of genes with decreased expression in KLF15-LKO (left) and increased in KLF-LKO (right). Average signal profile (rpm/bp) is plotted below each heatmap. (F) Top: Gene set enrichment analysis (GSEA) leading edge enrichment score for the set of genes down-regulated in KLF15-LKO and the set of genes with KLF15 promoter peak by ChIP-seq (n = 143). Bottom: Waterfall plot of total promoter ATAC-seq peak signal ranked by log2 fold change (KLF15-LKO/control).

