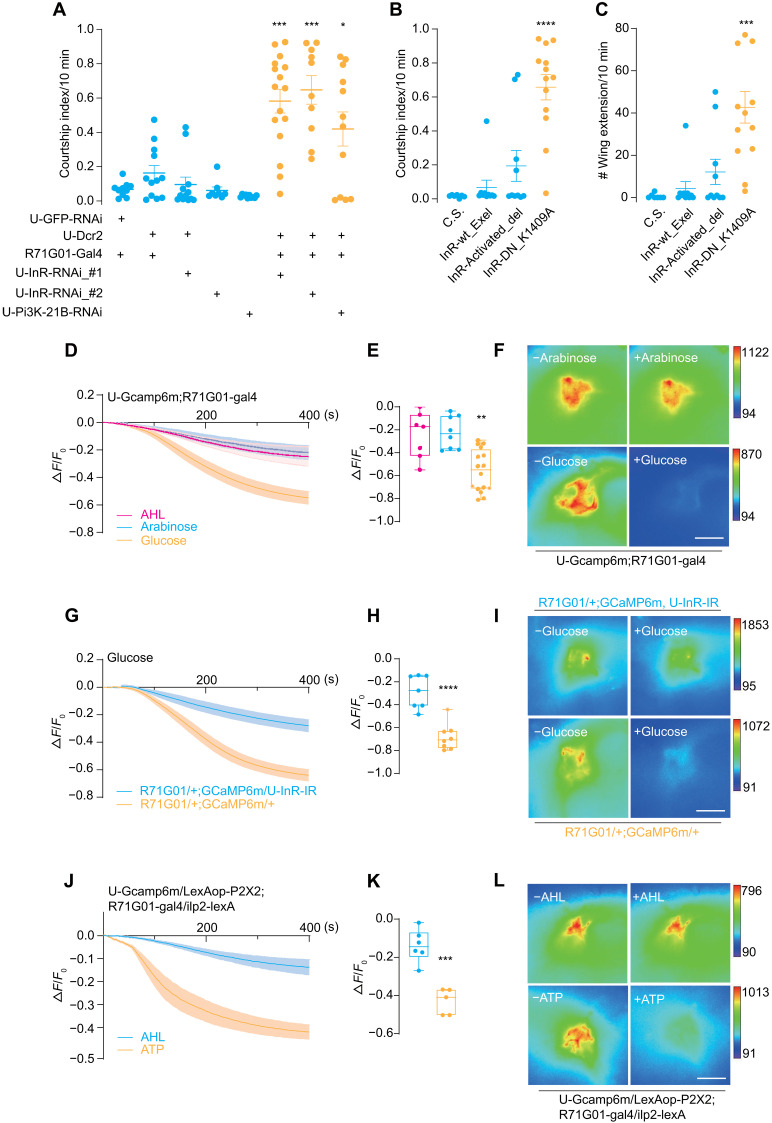
Fig. 2. Male P1 neurons are inhibited by ILP2 via the insulin-like receptor InR.
(A) Down-regulation of InR signaling in P1 neurons induced intermale courtship. Courtship index between two males with various genotypes. Two separate UAS-InR-RNAi lines and a UAS-Pi3K-21B-RNAi line were expressed in P1 neurons with R71G01-Gal4. N = 10 to 16 in each group. (B and C) P1-specific expression of a dominant-negative form of InR (K1409A) induced intermale courtship. InR-wt_Exel, InR-Activated_del, and InR-DN_K1409A represented wild-type, constitutively active, and dominant-negative forms of InR, respectively. All forms were driven by R71G01-Gal4. N = 7 to 13 in each group. (D to F) Glucose decreased P1 activity. Fluorescence changes (ΔF/F0) of GCaMP6m in P1 neurons after the application of glucose (2.8 mM), AHL buffer, and arabinose (2.8 mM). Sugar solutions were added at 10 s. N = 7 to 10 in each group. (G to I) Glucose-induced inhibition on P1 activity required InR. Fluorescence changes (ΔF/F0) of GCaMP6m intensity in P1 neurons along with InR-RNAi driven by R71G01-Gal4. N = 7 to 8 in each group. (J to L) Activation of IPCs via P2X2 inhibited P1 activity. Fluorescence changes (ΔF/F0) of GCaMP6m in P1 neurons after adding either 1 mM ATP or AHL buffer. N = 5 to 6 in each group. Statistical significance was assessed by one-way ANOVA followed by Dunnett’s test for multiple comparisons (A to C and E) and two-tailed unpaired t test (H and K). In all analyses, statistical differences were represented as follows: *P < 0.05, **P < 0.01, ***P < 0.001, and ****P < 0.0001. Data were represented as means ± SEM except for the box plot: minimum to maximum and median value (E, H, and K). Scale bars, 10 μm (F, I, and L).

