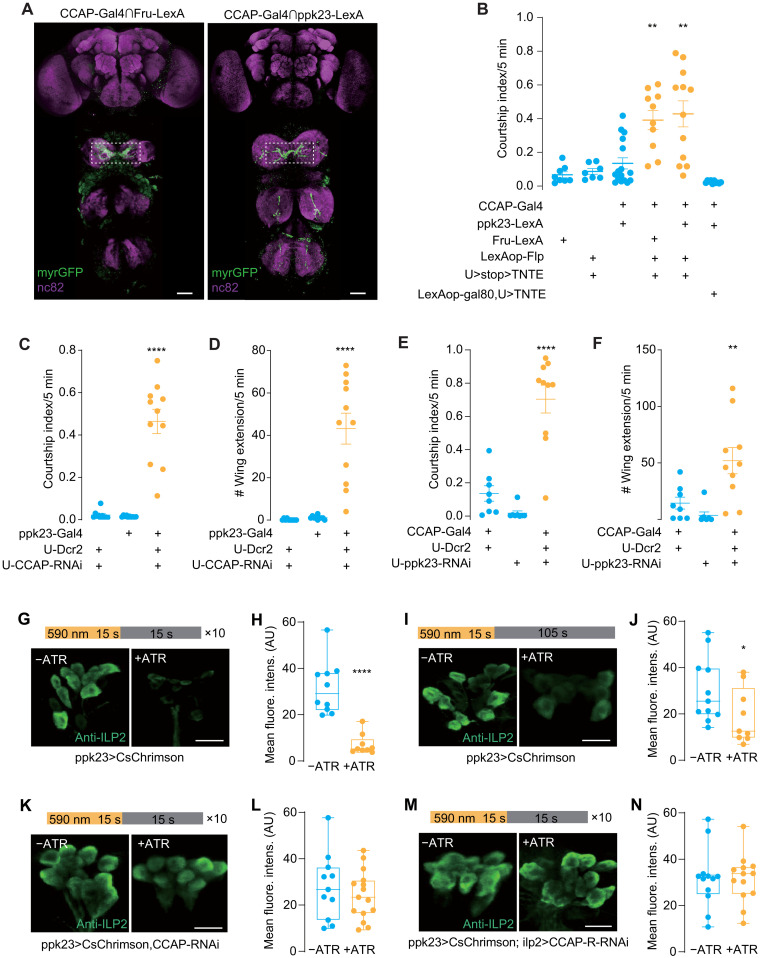
Fig. 5. CCAP functions in leg tarsal PPK23 neurons to inhibit intermale courtship.
(A) Cross-midline projections into VNC from intersections of CCAP/Fruitless (left) or CCAP/PPK23 (right). Dotted box indicated anti-GFP (green fluorescent protein) signals. Scale bars, 20 μm. (B) Silencing CCAP-Gal4/Fru-LexA and CCAP-Gal4/PPK23-LexA colabeled neurons induced intermale courtship. Courtship index was quantified between males of indicated genotypes. N = 7 to 12. (C and D) Knockdown of PPK23 in CCAP neurons induced intermale courtship. Courtship index (C) and single-wing extension number (D) were counted. N = 8 to 10. (E and F) Knockdown of CCAP in PPK23 neurons induced intermale courtship. Courtship index (E) and single-wing extension number (F) were counted. N = 10 to 12. (G and H) Repeated activation of PPK23 neurons induced ILP2 release from IPCs. CsChrimson was driven by ppk23-Gal4. Light stimulation program was listed. All-trans retinal (ATR) was supplied (+ATR) or not (−ATR). N = 7 to 8. (I and J) Single activation of PPK23 neurons. Similar to (G and H) except for light stimulation of 15 s. ATR was supplied (+ATR) or not (−ATR). N = 10 to 11. (K and L) Knockdown of CCAP in PPK23 neurons blocked ILP2 release upon stimulating PPK23 neuron. CsChrimson and CCAP-RNAi were expressed with ppk23-Gal4. N = 14 to 15. (M and N) Knockdown of CCAP-R in IPCs blocked ILP2 release upon PPK23 neuron stimulation. CsChrimson and CCAP-R-RNAi were driven by ppk23-LexA and ilp2-Gal4, respectively. N = 8 to 12. Mean fluorescence intensity (AU) of IPCs was compared between groups (G to N). One-way ANOVA followed by Dunnett’s test for multiple comparisons (B to F) and two-tailed unpaired t test (H, J, L, and N) were used. Statistical differences were represented as follows: *P < 0.05, **P < 0.01, and ****P < 0.0001. Data were represented as means ± SEM, except for the box plot: minimum to maximum and median value (H, J, L, and N). Scale bars, 10 μm (G, I, K, and M).

