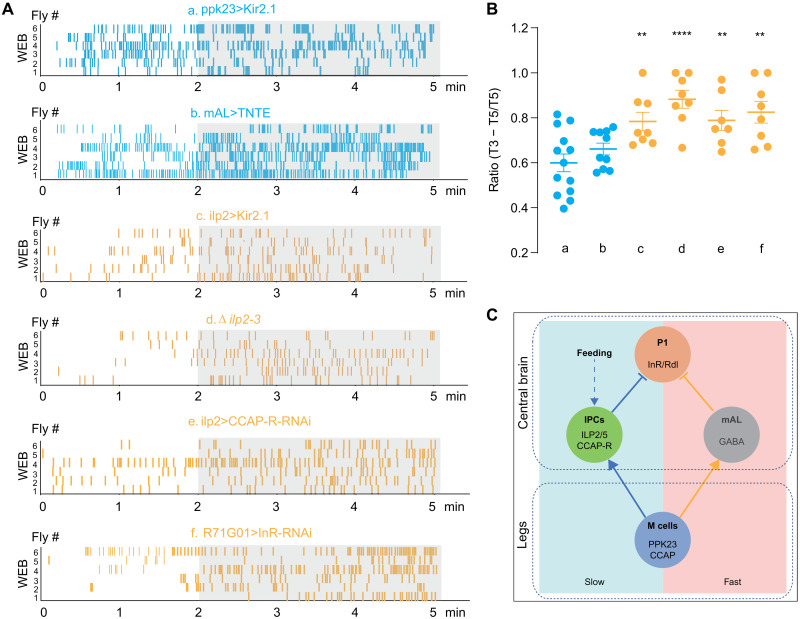
Fig. 7. CCAP-ILP2-P1 axis induces a delayed inhibition of male-male courtship.
(A) Raster plot of wing-extension bouts (WEB) for males of indicated phenotypes. From top to bottom: a, males with silenced PPK23 cells (ppk23-Gal4>UAS-Kir2.1); b, males with silenced mAL cells (R43D01-Gal4>UAS-TNTE); c, silenced IPCs (ilp2-Gal4>UAS-Kir2.1); d, ilp2 mutant males; e, males with CCAP-R knocking down in IPCs using ilp2-Gal4; and f, InR knocking down in P1 neurons using R71G01-Gal4. Raster plots of WEB in 5 min were presented. (B) Quantification of male WEB in listed males. Percentage of bouts in the last 3 min of total 5 min (T3 − T5/T5) was calculated. N = 7 to 13 in each group. The corresponding genotypes were correlated with a to f in (A). (C) Schematic of the neural circuits in males that suppress futile courtship. Left (light blue): The neural circuit that controlled the delayed suppression to inappropriate mates. Right (light red): The pathway that rapidly suppresses male’s sexual drive toward futile mates. In all analyses, statistical significance was assessed by one-way ANOVA followed by Dunnett’s test for multiple comparisons, and statistical differences were represented as follows: **P < 0.01 and ****P < 0.0001. Data were represented as means ± SEM. GABA, γ-aminobutyric acid.

