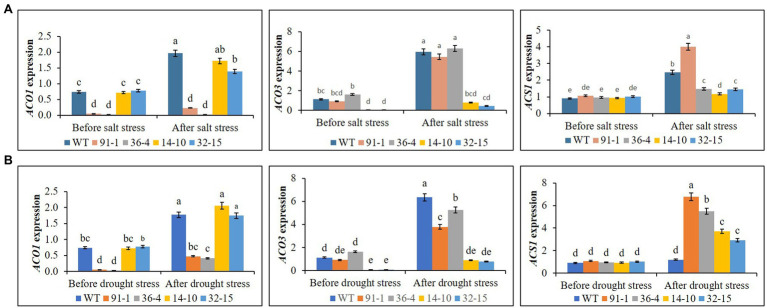
Figure 10.
Comparison of transcript levels of ethylene biosynthesis genes (ACS1, ACO1, and ACO3) expressed in the leaves of wild type (WT) petunia cv. “Mirage Rose” and mutants [phaco1 (91-1 and 36-4) and phaco3 (14-10 and 32-15)] before stress condition and after salt stress (A) and drought stress condition (B). Data represent the means of three replicates, and error bars indicate standard error. Means with the same letters are not significantly different by Least Significant Different Test (LSDT, p < 0.05).

