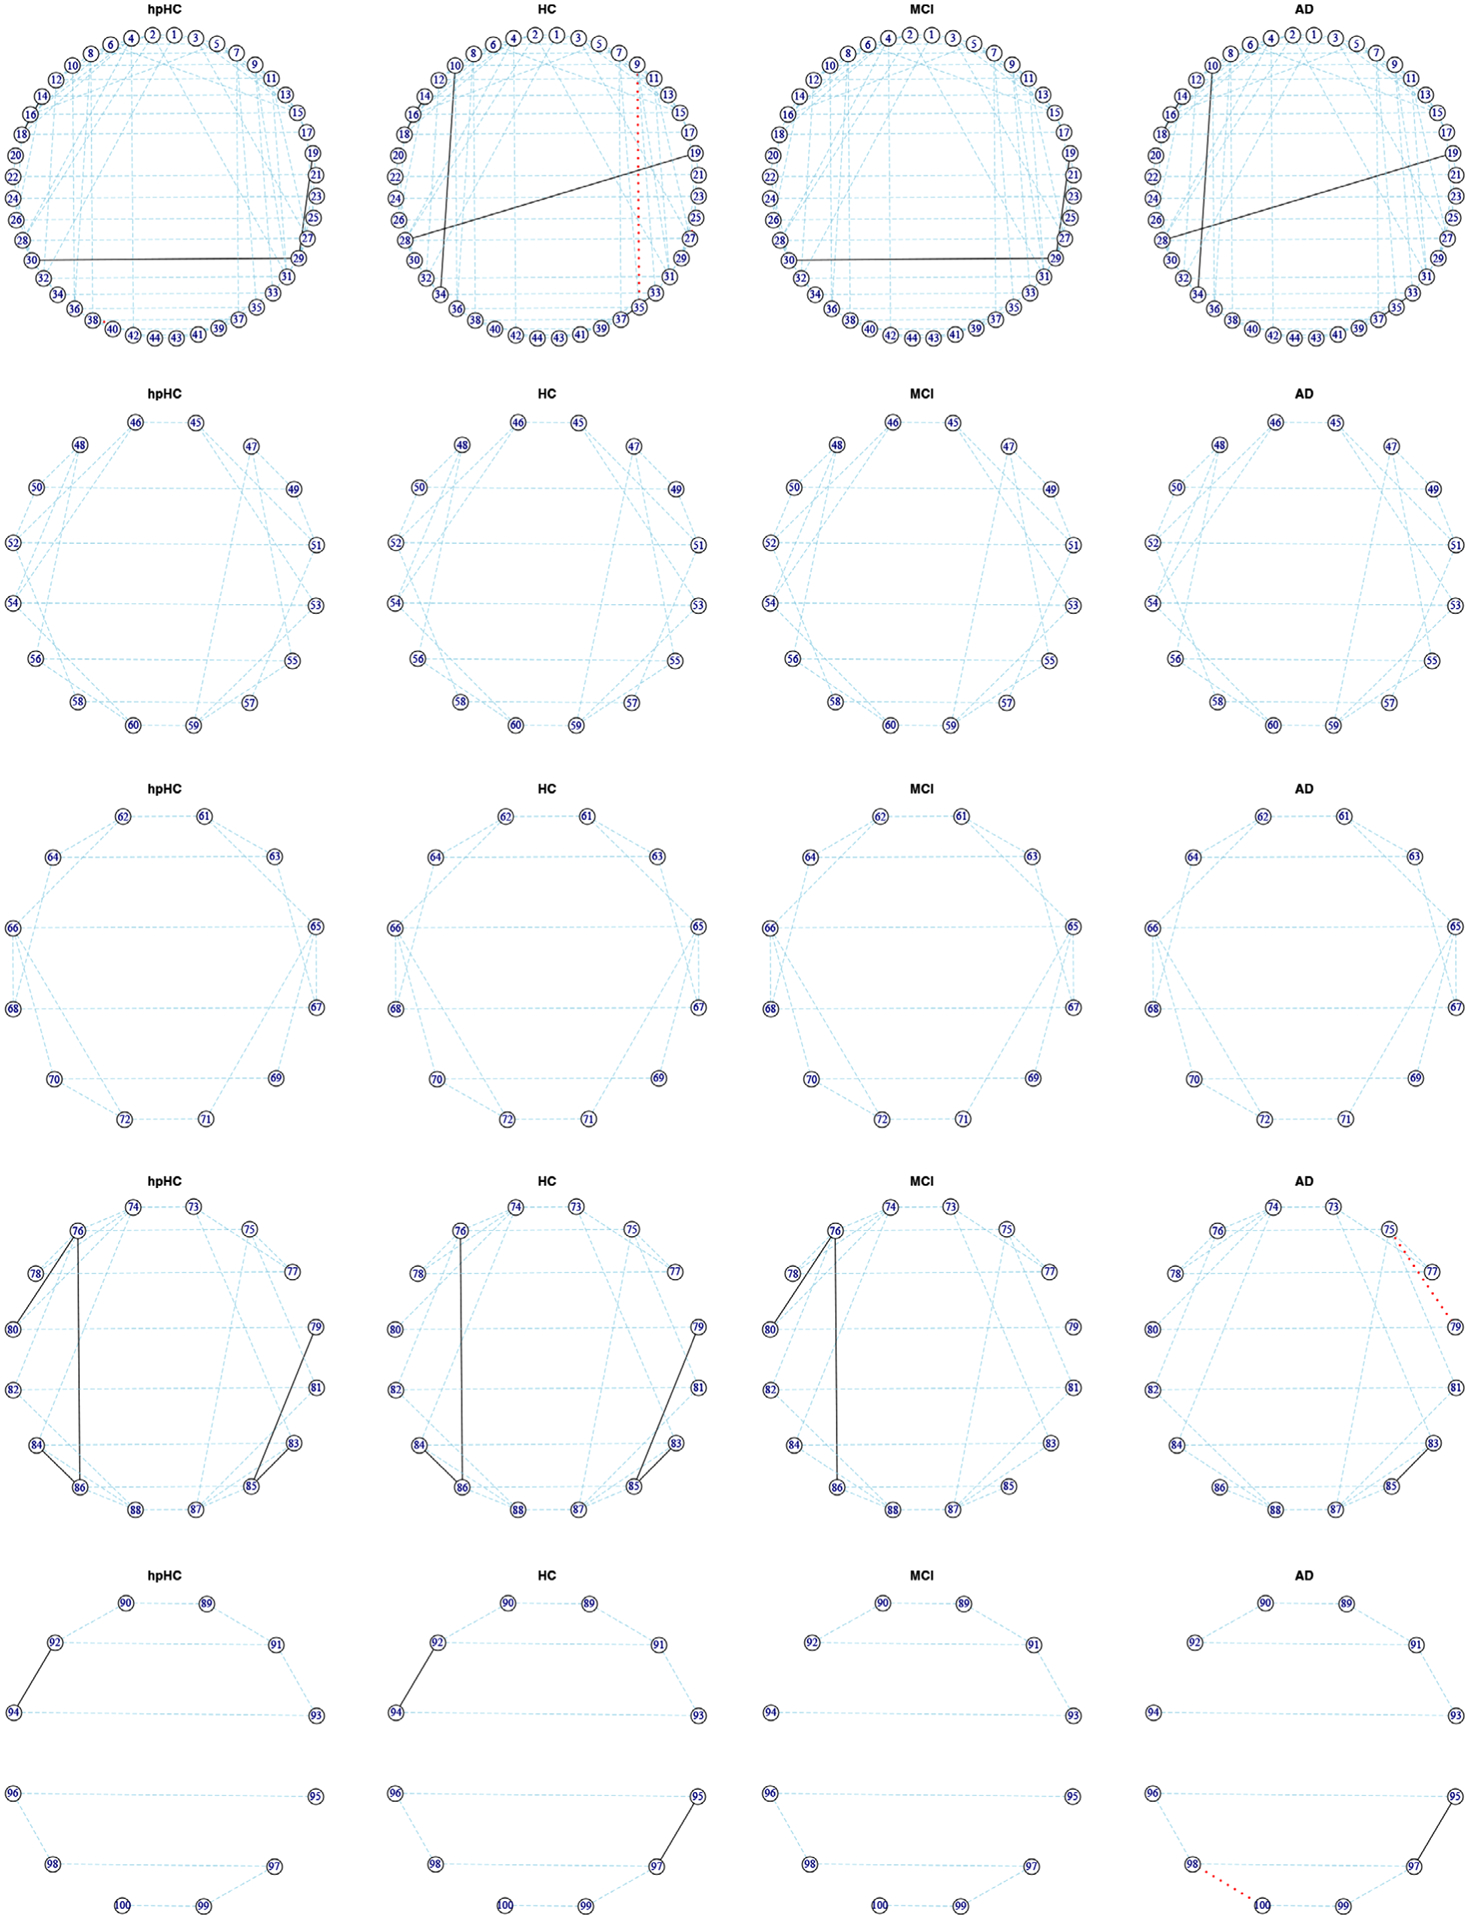
FIGURE 3.

Case study results discussed in Section 3.3. Subnetworks corresponding to the frontal, temporal, parietal, occipital, and limbic lobes (from top to bottom), for the four groups of subjects, where the edges shown are those selected in the median model. The left side of each circular array represents the left brain hemisphere, and the right side represents the right brain hemisphere. Blue lines indicate edges shared by all four groups, red lines indicate edges unique to an individual group, and black lines those shared by two or more groups. This figure appears in color in the electronic version of this article, and any mention of color refers to that version
