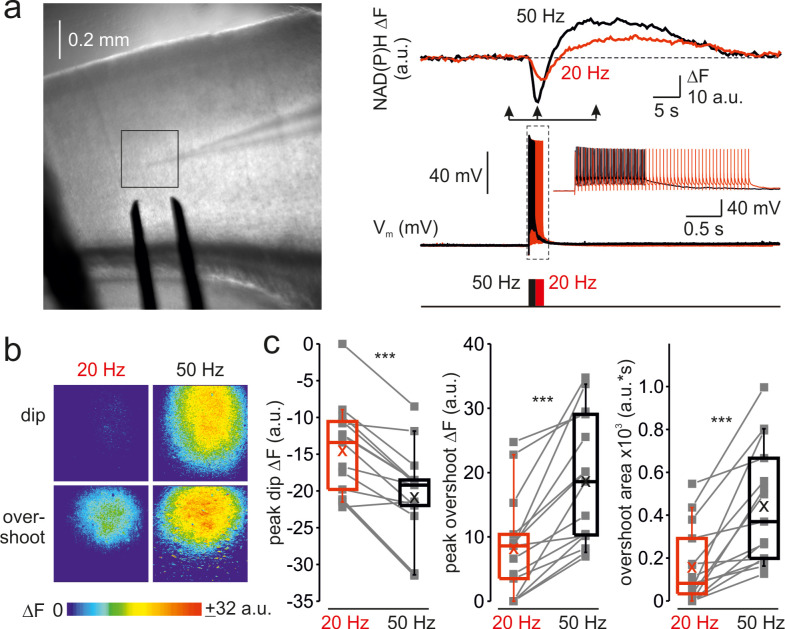
Figure 3. Frequency-dependent amplification of spike elicited changes in mitochondrial NAD(P)H auto-fluorescence.
(a) In a representative cortical slice, changes in NAD(P)H fluorescence in response to extracellular stimuli trains depend on stimulation frequency. Left, DIC image of a coronal slice during the electrical and optical recording. The rectangle indicates the region from which the auto-fluorescence measurements were obtained. The stimuli were delivered via the bipolar electrode placed on the white-gray matter border, and the whole-cell recording was obtained from an L5 neuron within the same cortical column. Right, The membrane potential and optical traces evoked by trains of 50 just suprathreshold stimuli at 50 Hz (black) and 20 Hz (red). Notice that both dip and overshoot of the NAD(P)H signals are more prominent at 50 Hz. Inset: Stimuli intensity was carefully adjusted to elicit only a single AP per stimulus. (b) The amplitude of NAD(P)H signals depends on stimulation frequency, whereas their spatial extent does not. Shown are pseudocolor maps of change in the NAD(P)H fluorescence between the times marked by the arrowheads in a. (c) Higher frequency stimulation causes an increase in the magnitude of the dip and of the overshoot of the NAD(P)H signal. Box plots representing the peaks of the dip (left), the peaks of the overshoot (middle), and the area of the overshoot (right) of the NAD(P)H signals evoked by trains of 20 Hz (red) and 50 Hz (black) stimuli. The gray lines connect the paired values obtained from the same cortical regions at two firing frequencies (n = 15 ROIs, ten cortical slices, three mice). Box plots represent the 25–75% interquartile range, and the whiskers expand to the 5–95% range. A horizontal line inside the box represents the median of the distribution, and the mean is represented by a cross symbol (X).


