. 2022 Feb 22;11:e73021. doi: 10.7554/eLife.73021

Figure 1. Microglia lacking TREM2 show exaggerated Ca2+ responses to purinergic stimulation.

(A) Representative red-green channel overlay images of wild type (WT) (top) and TREM2 knockout (KO) (bottom) induced pluripotent stem cell (iPSC)-microglia loaded with Fluo-4 (green) and Fura-red (red) showing resting cytosolic Ca2+ before ADP, and Ca2+ levels 15 s and 5 min after ADP addition. Scale bar = 20 μm. (B) Average traces (left panels) showing changes in cytosolic Ca2+ in response to 2.5 μM ADP in 1 mM Ca2+ buffer (n = 39–44 cells). Baseline-subtracted peak Ca2+ response and cytosolic Ca2+ levels 5 min after ADP shown on the right (n = 250–274 cells, five experiments, Mann–Whitney test). (C, D) Cytosolic Ca2+ response to ADP as in (A) and (B) but in iPSC-microglia expressing the GCaMP6f-tdTomato fusion Ca2+ probe Salsa6f (n = 41–53 cells, two independent experiments, Mann–Whitney test). Images in (C) are overlay of GCaMP6f (green) and tdTomato (red) channel images. Scale bar = 20 μm. (E) Ca2+ responses to 2.5 μM ATP in WT and TREM2 KO iPSC-microglia. Average traces (left panel, n = 63–71 cells) and bar graph summary of peak cytosolic Ca2+ and Ca2+ after 5 min (right panel, 165–179 cells, three experiments, Mann–Whitney test). (F) Ca2+ responses to 10 μM UTP. Average traces (45–55 cells) and summary of peak cytosolic Ca2+ and Ca2+ after 5 min (175–269 cells, three experiments, Mann–Whitney test). Data shown as mean ± SEM for traces and bar graphs. p-Values indicated by *** for p<0.001, ****p<0.0001.

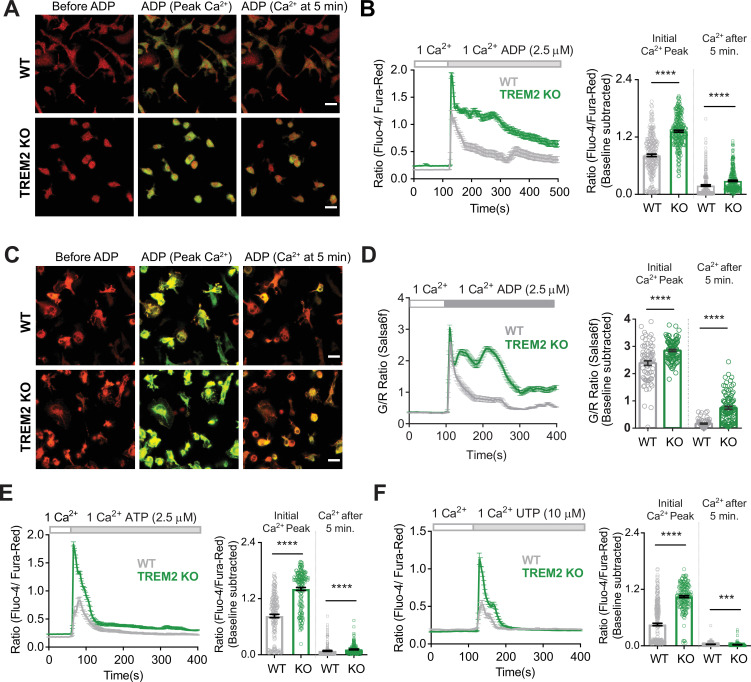
Figure 1—source data 1. Microglia lacking TREM2 show exaggerated Ca2+ responses to purinergic stimulation.
In this dataset, the results of microglial stimulation with purinergic agonists and validation of Salsa6f isogenic microglia are included.
elife-73021-fig1-data1.xlsx (152.9KB, xlsx)

Figure 1.

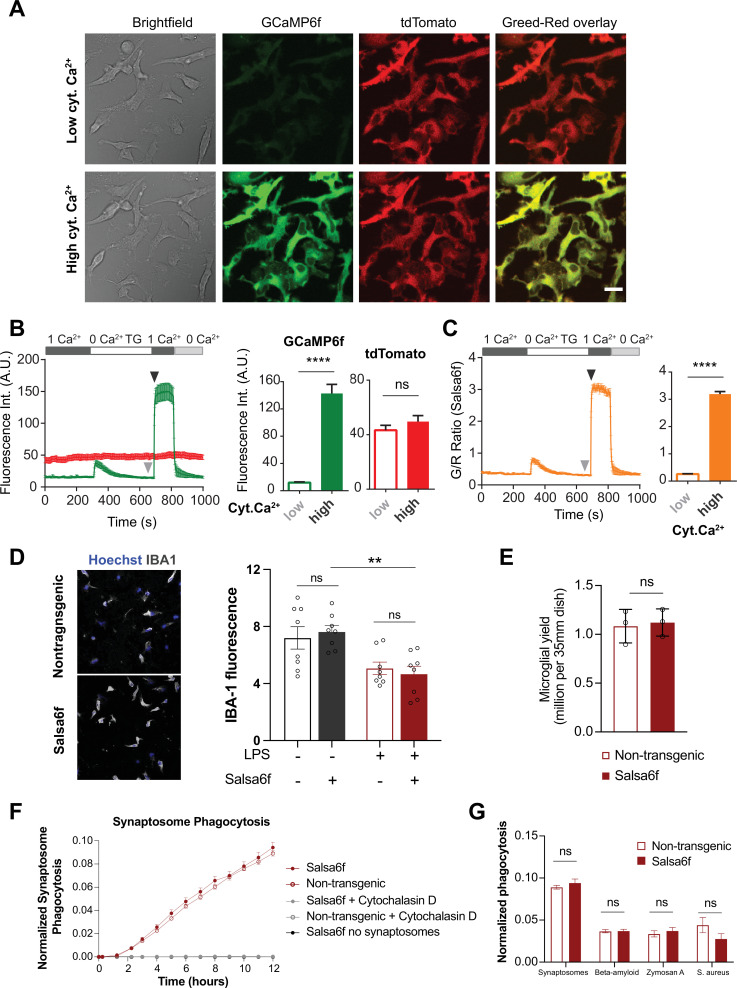
Figure 1—figure supplement 1. Validation of Salsa6f transgenic induced pluripotent stem cell (iPSC)-microglia.

Figure 1—figure supplement 1.

(A) Representative bright field, green (GCaMP6f), red (tdTomato), and green/red channel overlay images of transgenic Salsa6f expressing iPSC-microglia at low (top row) and high (bottom row) cytosolic Ca2+ levels. Cells were treated with 2 μM thapsigargin (TG) to deplete stores and evoke store-operated Ca2+ entry (SOCE). Images are shown at the end of TG treatment for low Ca2+ and at the peak of SOCE for high Ca2+. Scale bar = 20 μm. (B) Trace of average change in fluorescence intensity of tdTomato (red) and GCamp6f (green) over time. Summary of GCaMP6f and tdTomato intensities before and after invoking SOCE is shown on the right. (C) Ratiometric GCaMP6f/ tdTomato signal (green/red or G/R ratio) over time calculated from (B). Summary of G/R ratio at low and high cytosolic Ca2+ (B, C, n = 19 cells, Mann–Whitney test). (D) Immunofluorescence images showing staining for the microglia-specific marker IBA1 in either resting or activated wild type (WT) or Salsa6f-transgenic iPSC-microglia (left). Right panel shows quantification of IBA1 protein expression (n = 4 wells, two independent images per well, t-test). Cells were activated with 100 ng/mL lipopolysaccharide (LPS for 24 hr). (E) Microglia cell counts at final day of differentiation (n = 3 wells, t-test). (F) Phagocytosis of synaptosomes in WT non-transgenic (open circle) and Salsa6f-expressing (closed circle) iPSC-microglia. Cytochalasin D (gray, 10 µM) used as negative control to inhibit phagocytosis. Live cultures imaged on IncuCyte S3 (n = 4 wells; four images per well). (G) Phagocytic load at 24 hr for synaptosomes, beta-amyloid, zymosan A, and S. aureus (n = 4 wells; four images per well; one-way ANOVA with Tukey post-hoc test). Data shown as mean ± SEM for traces and bar graphs. p-Values indicated by ns for nonsignificant, ****P<0.0001.
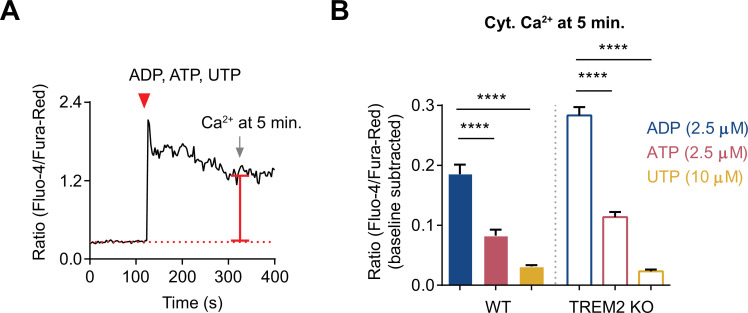
Figure 1—figure supplement 2. Comparison of cytosolic Ca2+ signal over time triggered by various purinergic agonists.

Figure 1—figure supplement 2.

(A) Representative trace showing changes in cytosolic Ca2+ in a single cell to illustrate the scheme for measuring cytosolic Ca2+ level 5 min after agonist application. (B) Bar graph summary of cytosolic Ca2+ levels in wild type (WT) and TREM2 knockout (KO) induced pluripotent stem cell (iPSC)-microglia 5 min after application of 2.5 μM ADP (blue), 2.5 μM ATP (red), and 10 μM UTP (yellow). N = 165–274 cells pooled from 2 to 3 experiments. One-way ANOVA with multiple comparisons. Data shown as mean ± SEM for the bar graph. p-Values indicated by ****p<0.0001.