. 2022 Feb 22;11:e73021. doi: 10.7554/eLife.73021

Figure 3. Regulation of ADP-evoked store-operated Ca2+ entry (SOCE) in wild type (WT) and TREM2 knockout (KO) microglia.

(A) SOCE in WT microglia triggered with thapsigargin (TG, 2 μM) in Ca2+-free buffer followed by readdition of 1 mM Ca2+ in the absence (control, gray trace) or presence (red trace) of the Orai channel inhibitor Synta66 (n = 34–48 cells). Cells were pretreated with Synta66 (10 μM) for 30 min before imaging. Bar graph summary of the rate of Ca2+ influx (n = 80–137 cells, two experiments, Mann–Whitney test). (B) SOCE evoked by ADP (2.5 μM) in WT microglia (gray trace) using a similar Ca2+ addback protocol as in (A). Red trace shows the effect of Synta66 on ADP-evoked SOCE. Right panel shows bar graph summary of the rate of ADP-triggered Ca2+ influx after readdition of 1 mM Ca2+ (n = 148–155 cells, two experiments, Mann–Whitney test). (C) Comparison of SOCE evoked with TG (2 μM) in WT and TREM2 KO cells (n = 90–129 cells). Bar graph summaries of endoplasmic reticulum (ER) store release quantified as area under the curve, rate of SOCE, and peak SOCE (n = 187–266 cells, two experiments, Mann–Whitney test). (D) Traces showing ADP-evoked SOCE in WT and TREM2 KO microglia after depleting stores with 100 nM ADP in Ca2+-free buffer and readdition of 1 mM Ca2+ (left panel, n = 97–114 cells). Comparison of ADP-evoked cytosolic Ca2+ peak, peak SOCE and SOCE rate (right panel, n = 234–313 cells, three experiments, Mann–Whitney test). (E) Ionomycin pulse experiment to measure residual ER Ca2+ pool in cells after initial treatment with ADP. WT and TREM2 KO cells were pulsed sequentially with ADP first (200 nM) and subsequently treated with ionomycin (1 μM) to empty and measure the residual pool of ER Ca2+. Imaging was done entirely in Ca2+-free buffer to prevent Ca2+ influx across the plasma membrane (PM). Average trace (left panel), peak ADP Ca2+ response (middle panel), and peak ionomycin-induced Ca2+ response (right panel) (n = 38–60 cells, 3–4 experiments, Mann–Whitney test). (F) Average trace (left, 71–117 cells) and summary of ER store release after 2 μM ionomycin treatment in Ca2+-free buffer (right, 146–234 cells, two experiments; nd, nonsignificant p>0.05, Mann–Whitney test). (G) Same as (H) but in response to UV IP3 uncaging (167–200 cells, ns, nonsignificant p>0.05, nonparametric t-test). Data shown as mean ± SEM for traces and bar graphs. Data are mean ± SEM. p-Values indicated by ns, nonsignificant, *p<0.05, and ****p<0.0001.

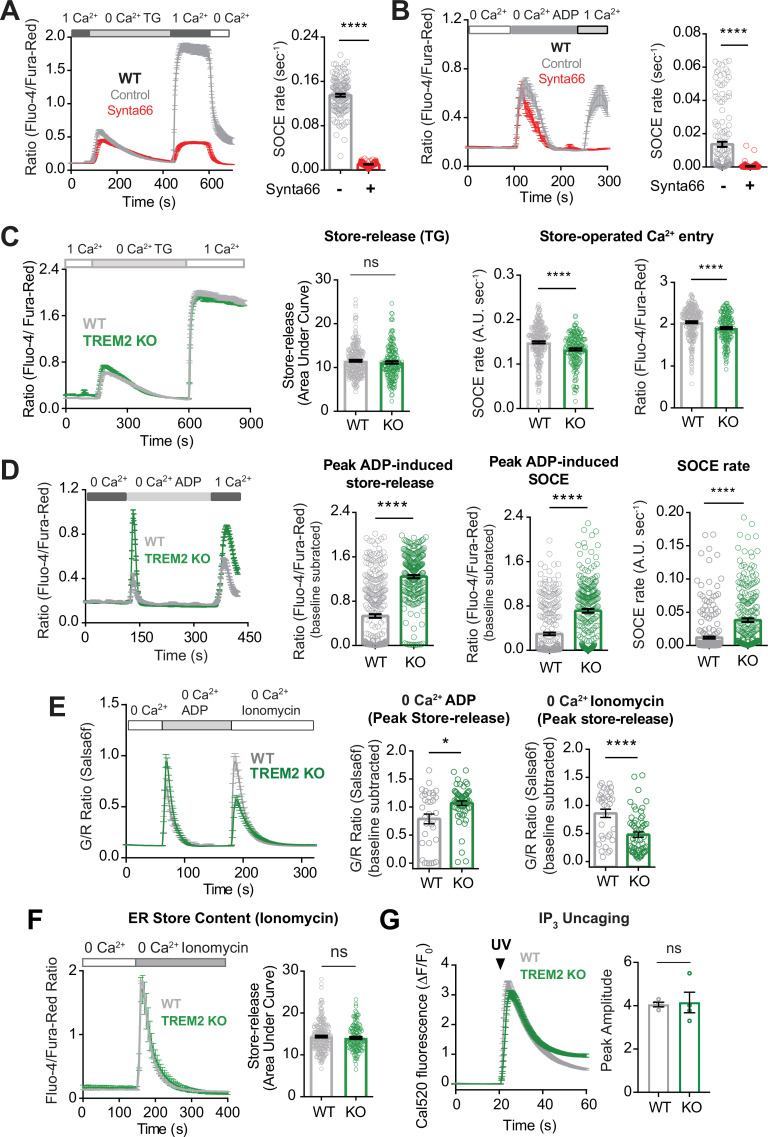
Figure 3—source data 1. Regulation of ADP-evoked store-operated Ca2+ entry (SOCE) in wild type (WT) and TREM2 knockout (KO) microglia.
In this dataset, the results of blocking SOCE on ADP stimulation and investigation of store content as well as the correlation between original calcium store release and SOCE are included.
elife-73021-fig3-data1.xlsx (436.6KB, xlsx)

Figure 3.

Figure 3—figure supplement 1. Regulation of store-operated Ca2+ entry (SOCE) in induced pluripotent stem cell (iPSC)-microglia.

Figure 3—figure supplement 1.

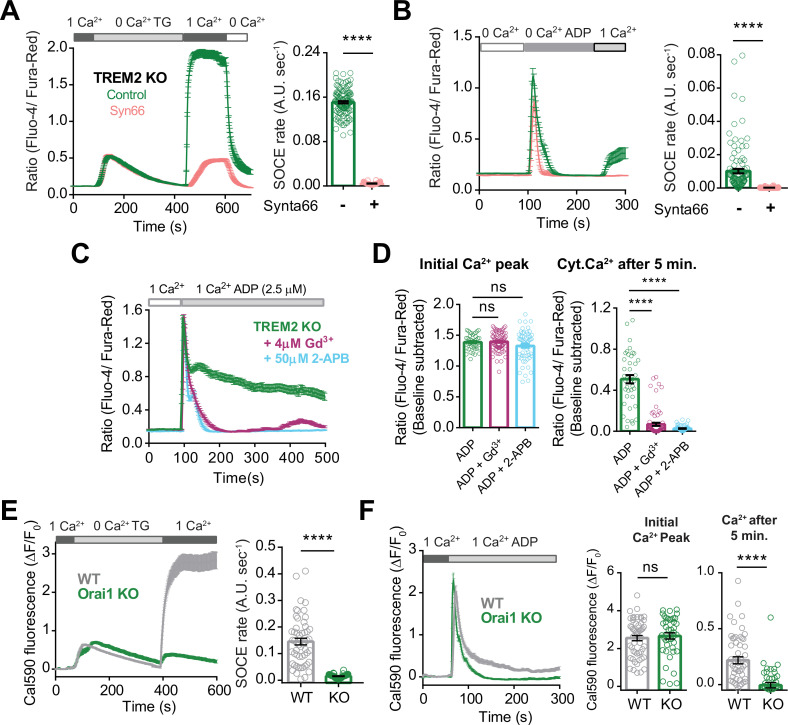
(A) Average trace showing SOCE triggered in TREM2 knockout (KO) microglia via emptying endoplasmic reticulum (ER) Ca2+ stores with thapsigargin (TG, 2 μM) in Ca2+-free buffer followed by readdition of 1 mM Ca2+ in the absence (control, green trace) or presence (red trace) of the Orai channel inhibitor Synta66. Cells were pretreated with Synta66 (10 μM) for 30 min before experiment. Bar graph summary of the rate of Ca2+ influx after readdition of 1 mM Ca2+ (80–126 cells, Mann–Whitney test). (B) SOCE evoked by ADP (2.5 μM) in TREM2 KO microglia (green trace) using a similar Ca2+ addback protocol. Red trace shows the effect of Synta66 on ADP-evoked SOCE. Right panel summarizes the rate of ADP-triggered Ca2+ influx after readdition of 1 mM Ca2+ (n = 125–154 cells, two experiments, Mann–Whitney test). (C, D) Cytosolic Ca2+ response to ADP in TREM2 KO iPSC-microglia pretreated with 2-APB (50 μM) or Gd3+ (5 μM) to block SOCE. Average traces (C), baseline-subtracted initial peak Ca2+ responses to ADP (D, left panel), and baseline-subtracted Ca2+ after 5 min of ADP addition (D, right panel) are shown (n = 41–74 cells, ordinary one-way ANOVA with multiple comparisons). (E, F) Role of Orai1 in TG- and ADP-evoked SOCE in iPSC-microglia. (E) Comparison of TG-evoked SOCE in WT and Orai1 KO cell showing average traces (left panel) and summary of SOCE rate (right panel; n = 42–54 cells, 3–4 experiments, Mann–Whitney test). (F) ADP-evoked SOCE in WT and Orai1 KO showing average traces (left panel) and summary of SOCE rate (right panel; n = 42–53 cells, 3–4 experiments, Mann–Whitney test). Data shown as mean ± SEM for traces and bar graphs. p-Values indicated by ns, nonsignificant, ****p<0.0001.
Figure 3—figure supplement 2. ADP depletes endoplasmic reticulum (ER) Ca2+ stores to a greater extent in TREM2 knockout (KO) microglia.

Figure 3—figure supplement 2.

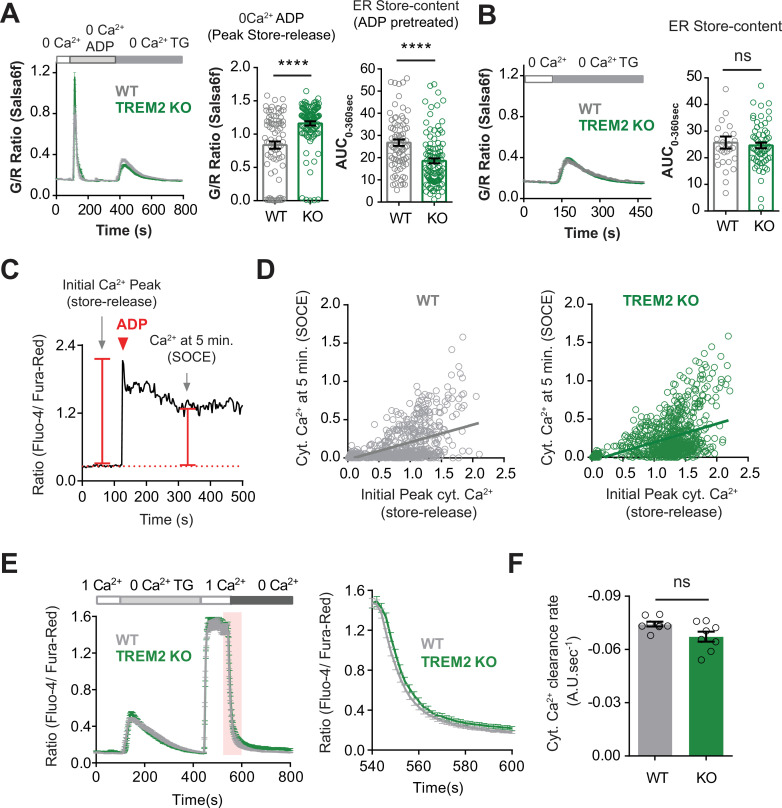
(A) Thapsigargin (TG) pulse experiment to measure residual ER Ca2+ pool in cells after initial treatment with ADP (1 μM) and subsequent treatment with TG (2 μM). Imaging was done in Ca2+-free buffer to prevent Ca2+ influx across the plasma membrane (PM). Average trace (left panel), peak ADP Ca2+ response (middle panel), and extent of TG-induced ER store release measured as area under the curve (AUC, right panel) (n = 81–108 cells, Mann–Whitney test). (B) Control experiment comparing the ER-Ca2+ pool in WT and TREM2 KO microglia after store depletion with TG and without any pretreatment with ADP (n = 29–63 cells, Mann–Whitney test). (C, D) Relationship between ADP-induced store release and store-operated Ca2+ entry (SOCE) in induced pluripotent stem cell (iPSC)-microglia. (C) Representative single-cell trace of Ca2+ signal in response to ADP in 1 mM extracellular Ca2+ buffer showing the scheme for measuring ER store release as the initial Ca2+ peak and SOCE as cytosolic Ca2+ level 5 min after ADP application. (D) Scatter plot showing correlation of initial ADP-induced Ca2+ response (store release) and cytoplasmic Ca2+ after 5 min (SOCE) in WT (gray) and KO (green) cells (n = 866–935 cells from multiple imaging runs with a range of ADP doses; in μM: 0.001, 0.1, 0.5, 1, 2, 2.5, 5, 10; comparison of slopes between WT and TREM2 KO: p=0.7631; extra sum of squares F-test). (E, F) Comparison of cytosolic Ca2+ clearance indicative of PMCA pump activity in WT and TREM2 KO microglia. SOCE was invoked and rate of Ca2+ decline was measured after addition of 0 mM Ca2+. (E) Average trace showing invoking SOCE with 2 μM TG (left panel). Right panel shows the drop in cytosolic Ca2+ following addition of Ca2+-free solution as highlighted (pink) in the SOCE trace. (F) Summary of rate of Ca2+ decline after addition of 0 mM Ca2+ (n = 8 imaging fields, 142–175 total cells, Mann–Whitney test). Data shown as mean ± SEM for traces and bar graphs. p-Values indicated by ns, nonsignificant, **p<0.01.