
Figure 2.
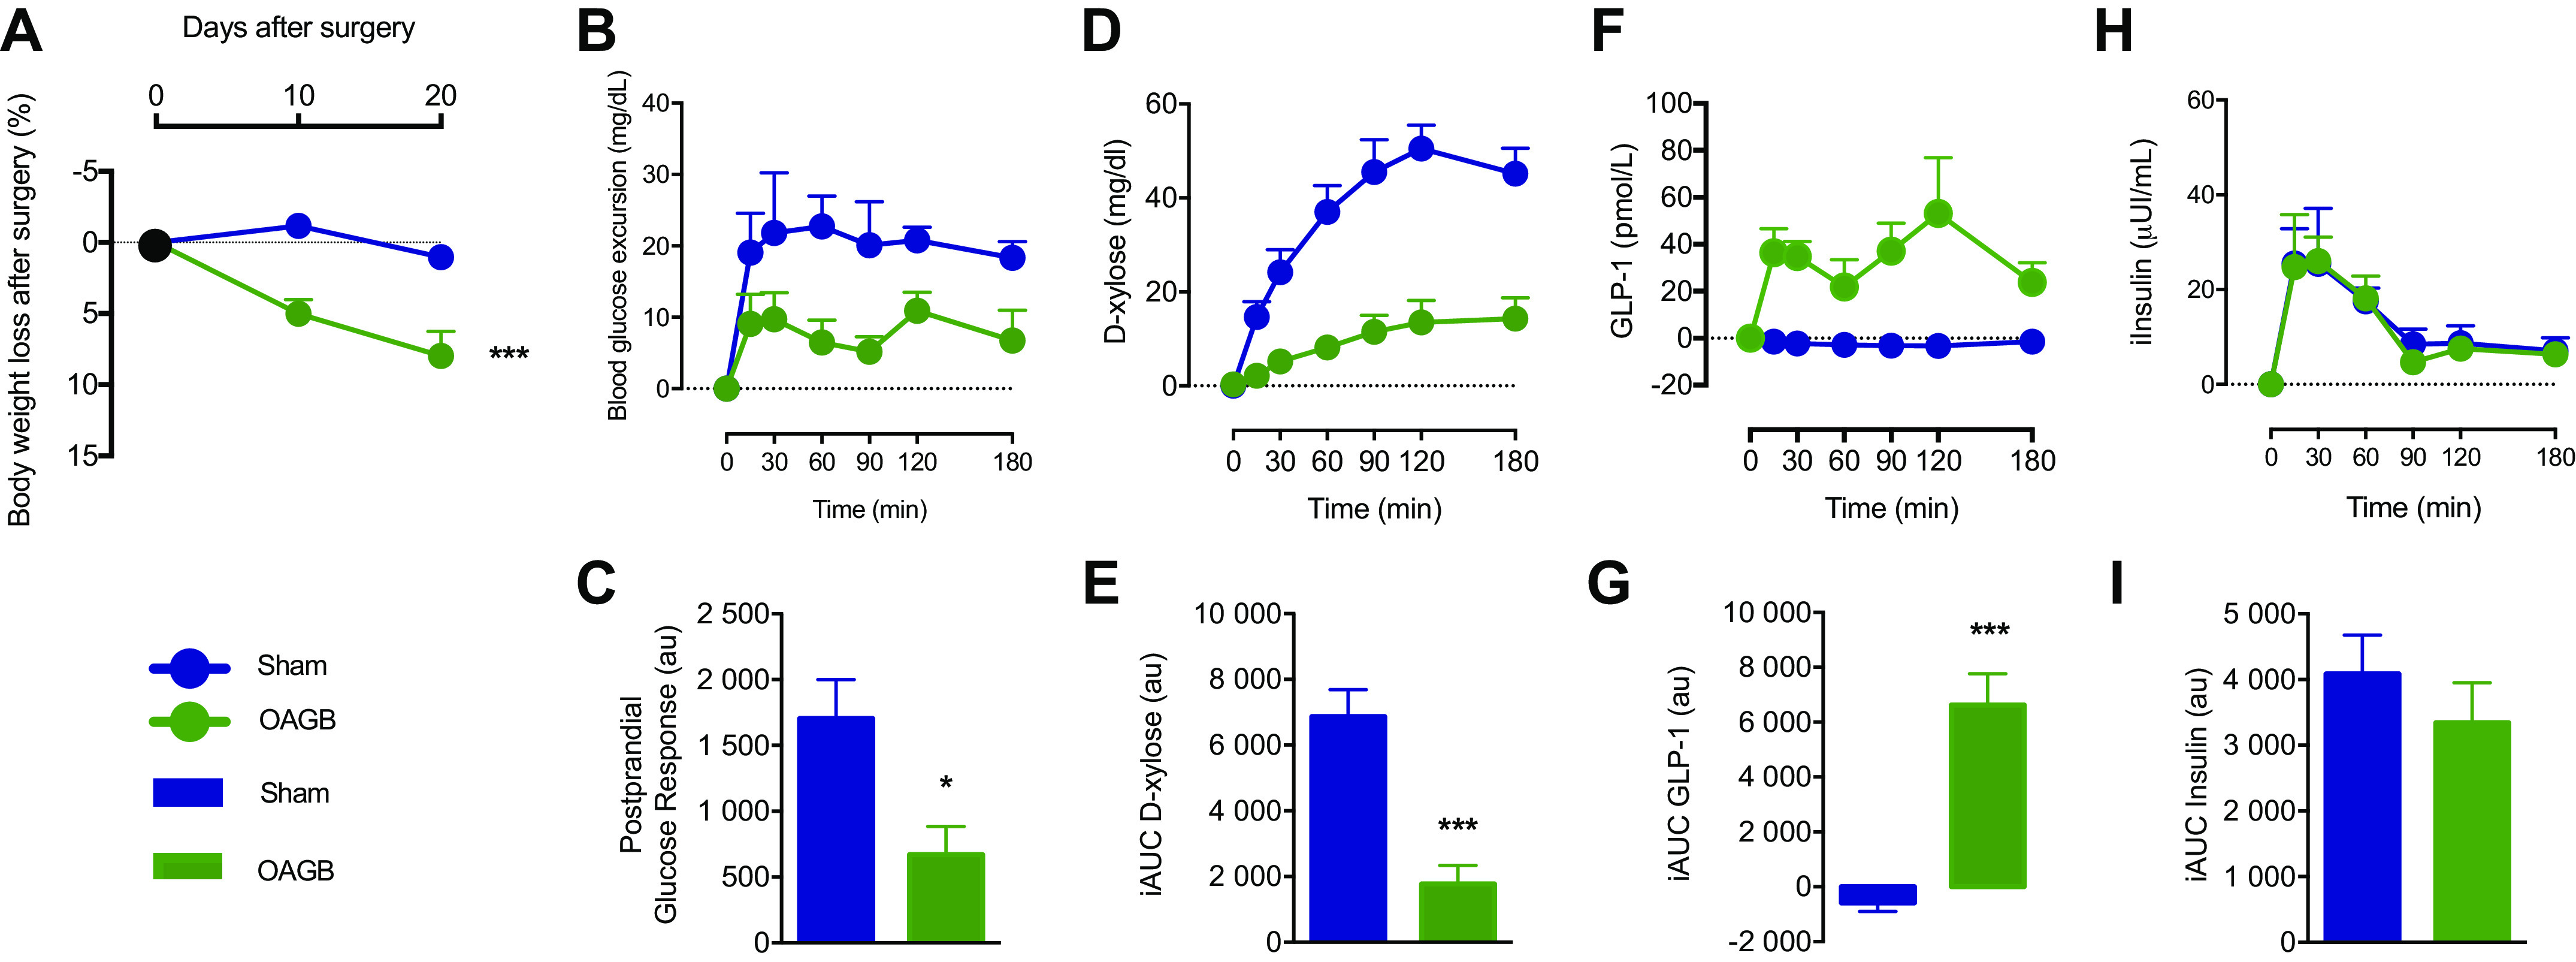
Weight loss and metabolic response to the mixed-meal test. A: weight loss at 10 and 20 days after surgery; B: blood glucose excursion (incremental blood glucose) during the mixed-meal test (MMT); C: postprandial glucose response (incremental AUC for blood glucose); D: d-xylose plasmatic profile during the MMT; E: incremental area under the curve for d-xylose; F: incremental GLP-1 excursion during the MMT; G: incremental area under the curve for GLP-1; H: incremental insulin excursion during the MMT; I: incremental area under the curve for insulin. Blue dot: Sham group, green dot: OAGB group, blue bar: Sham group, and green bar: OAGB group. Statistical analysis: two-way ANOVA (A), one-way ANOVA (C, E, G, and I). *P < 0.05; ***P < 0.001. AUC, area under the curve; GLP-1, glucagon-like peptide 1; OAGB, one anastomosis gastric bypass.