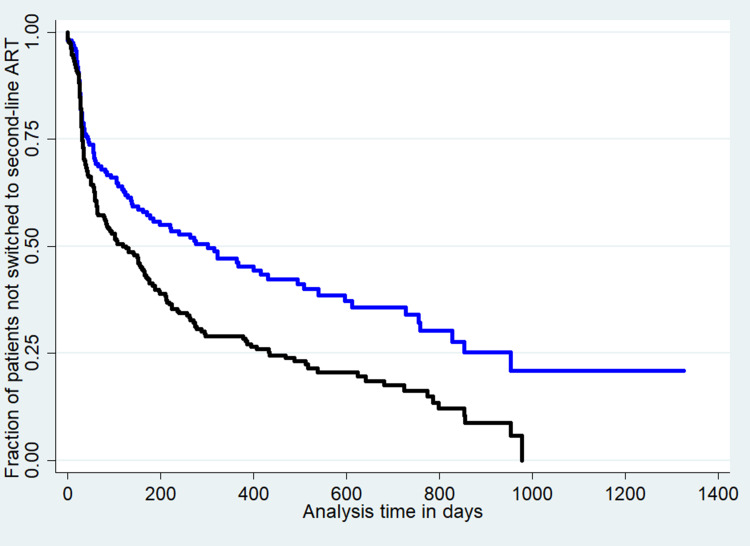
Figure 2.
The Kaplan–Meier survival curve by regimen change for time to switch to 2nd line Anti-Retroviral Therapy (ART) and its predictors among HIV-infected adults at high load public health facilities Northwest Ethiopia, from 2016 to 2020 (n=427). (Blue line=survival curve of patients with 1st line regimen change, Black line = survival curve of patients with 1st line regimen change).

