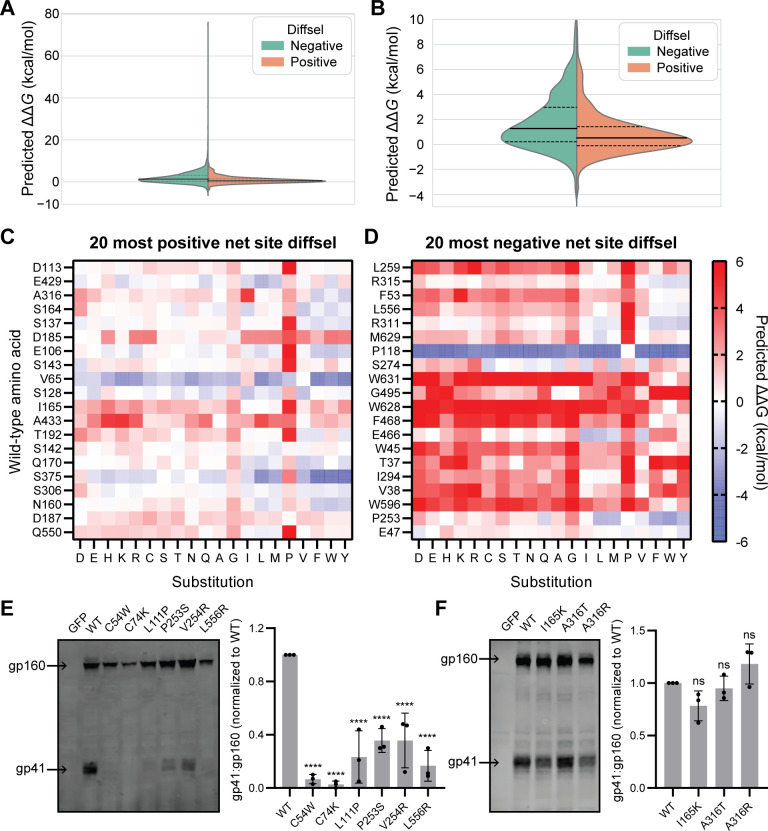
Fig 3. Env variants displaying negative differential selection (diffsel) upon XBP1s induction tend to be more destabilizing and exhibit greater processing defects than those displaying positive diffsel.
(A) Split violin plot depicting the distribution of ΔΔG values predicted using the Rosetta ΔΔG protocol, for all amino acid substitutions that were present in the filtered deep mutational scanning dataset for +XBP1s versus basal (2,379 negative diffsel variants; 756 positive diffsel variants). Dashed lines inside the violins indicate the first and third quartiles, and the solid line inside the violins indicates the median. (B) Zoom-in of the violin plot in (A) focusing on ΔΔG < 10 kcal/mol. (C and D) Heatmaps showing the predicted ΔΔG values for all possible amino acid substitutions at the 20 sites with the most positive net site diffsel (C) and the 20 sites with the most negative net site diffsel (D), upon XBP1s induction. Substitutions (x-axis) are arranged by side-chain properties: negatively charged (D, E), positively charged (H, K, R), polar uncharged (C, S, T, N, Q), small nonpolar (A, G), aliphatic (I, L, M, P, V), and aromatic (F, W, Y). Wild-type (WT) amino acids (y-axis) are arranged by rank order of net site diffsel, with (C) D113 most positive and (D) L259 most negative. Complete ΔΔG values are provided in S5 Data. (E) Representative immunoblot showing gp160 and gp41 bands for selected variants with negative diffsel upon XBP1s induction (left) and densitometric analysis of gp41:gp160 ratio across biological triplicates (right). (F) Representative immunoblot showing gp160 and gp41 bands for selected variants with positive diffsel upon XBP1s induction (left) and densitometric analysis of the gp41:gp160 ratio across biological triplicates (right). For (E) and (F), statistical significance was calculated by 1-way ANOVA followed by Dunnett’s test, comparing the mean of each variant to the mean of WT; ****p-value < 0.0001; ns, not significant. Immunoblots of biological triplicates are provided in S5 Fig, and replicate data values for densitometric analysis are provided in S6 Data.

