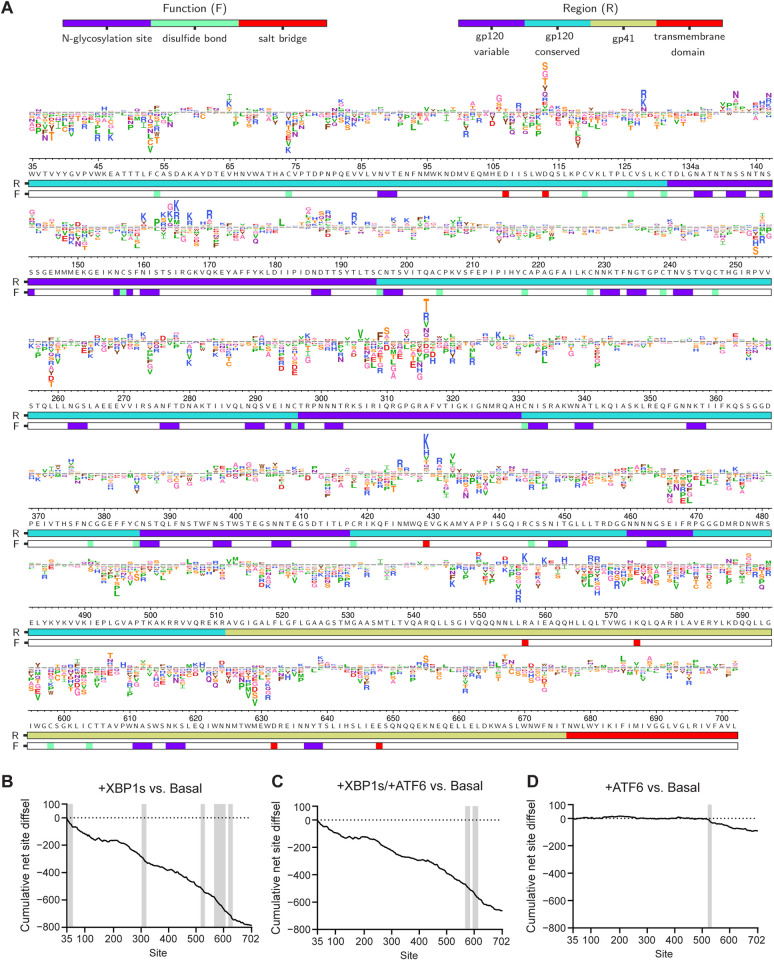
Fig 4. Differential selection (diffsel) across Env upon remodeling of the host’s endoplasmic reticulum proteostasis network.
(A) Logo plot displaying averaged diffsel for +XBP1s normalized to the basal proteostasis environment. The height of the amino acid abbreviation is proportional to the magnitude of diffsel. The amino acid abbreviations are colored based on their side-chain properties: negatively charged (D, E; red), positively charged (H, K R; blue), polar uncharged (C, S, T; orange/N, Q; purple), small nonpolar (A, G; pink), aliphatic (I, L, M, P, V; green), and aromatic (F, W, Y; brown). The numbers and letters below the logos indicate the Env site in HXB2 numbering and the identity of the wild-type amino acid for that site, respectively. The color bar below the logos indicates the function (F) that the site is involved in (N-glycosylation site [purple], disulfide bond [green], or salt bridge [red]) or the region (R) of Env that the site belongs to (gp120–variable [purple], gp120–conserved [cyan], gp41 [yellow], or transmembrane domain [red]; the sites that belong to the 5 variable loops of gp120 were categorized as “gp120–variable,” and the sites that are not included in the 5 variable loops were categorized as “gp120–conserved”). Only variants that were present in all 3 pre-selection viral libraries and exhibited diffsel in the same direction across all 3 biological triplicates are plotted here. Diffsel values and unfiltered logo plots for each individual replicate are provided at https://github.com/yoon-jimin/2021_HIV_Env_DMS. (B–D) Cumulative net site diffsel across Env sites for (B) +XBP1s, (C) +XBP1s/+ATF6, and (D) +ATF6, normalized to the basal proteostasis environment. Regions where the decrease in mutational tolerance is particularly prominent are shaded in grey (40–57, 302–319, 517–532, 565–607, and 617–633 for [B], 567–585 and 594–614 for [C], and 520–534 for [D]). Cumulative net site diffsel data values are provided in S8 Data.

