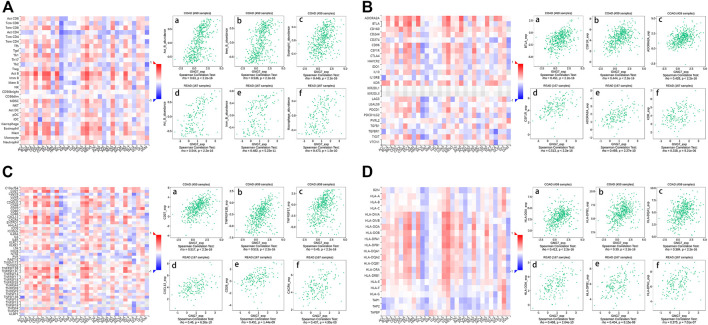
FIGURE 8.
Spearman’s correlation of GNG7 with lymphocytes and immunomodulators in TISIDB database. (A) Relationship between the abundance of TILs and GNG7 expression in different human cancers. Top 3 TILs displaying the greatest correlation with GNG7 expression in COAD (A–C) and READ (D–F). (B) Relationship between the abundance of immunoinhibitors and GNG7 expression in different human cancers. Top 3 immunoinhibitors displaying the greatest correlation with GNG7 expression in COAD (A–C) and READ (D–F). (C) Relationship between the abundance of immunostimulators and GNG7 expression in different human cancers. Top 3 immunostimulators displaying the greatest correlation with GNG7 expression in COAD (A–C) and READ (D–F). (D) Relationship between the abundance of MHC molecules and GNG7 expression in different human cancers. Top 3 MHC molecules displaying the greatest correlation with GNG7 expression in COAD (A–C) and READ (D–F).

