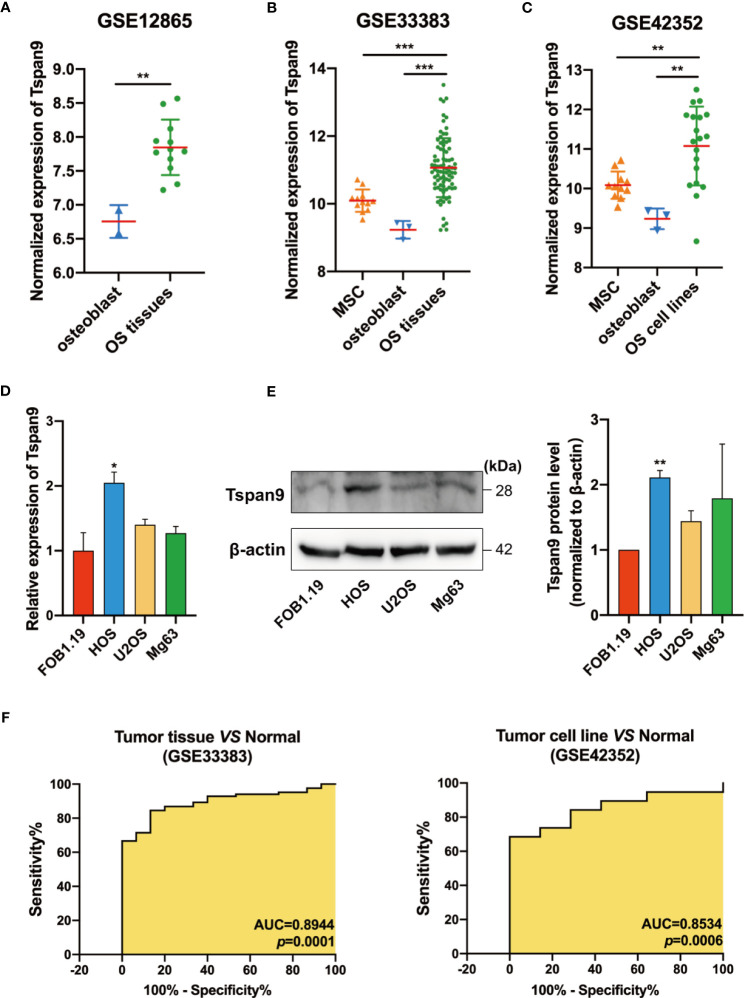
Figure 1.
Human OS cells and tumor tissue samples exhibit Tspan9 upregulation. (A–C) Tspan9 mRNA levels were significantly elevated in OS tumor tissues and cell lines in the GSE12865, GSE33383, and GSE42352 datasets relative to levels in normal MSCs and OBs. (D) Relative Tspan9 mRNA levels were markedly increased in HOS cells relative to control hFOB1.19 cells, whereas no changes were evident in U2OS or Mg63 cells as assessed via qRT-PCR. GAPDH served as a normalization control. (E) Western blotting results revealed that Tspan9 protein expression in HOS but not U2OS and Mg63 was significantly higher compared to hFOB1.19 cells. β-actin was used as a loading control and for normalization. Data are means ± SD from two independent experiments. (F) ROC curves and AUC values were determined using the GSE33383 and GSE42352 datasets. *P < 0.05; **P < 0.01; ***P < 0.001; Student’s t-test. Tspan9, Tetraspanin-9; MSC, mesenchymal stem cell; OB: osteoblast; OS: osteosarcoma; GEO: Gene Expression Omnibus; qRT-PCR, quantitative reverse -transcription polymerase chain reaction; GAPDH, glyceraldehyde-3-phosphate dehydrogenase; SD, standard deviation; ROC, receiver operating characteristic; AUC, area under the curve.

