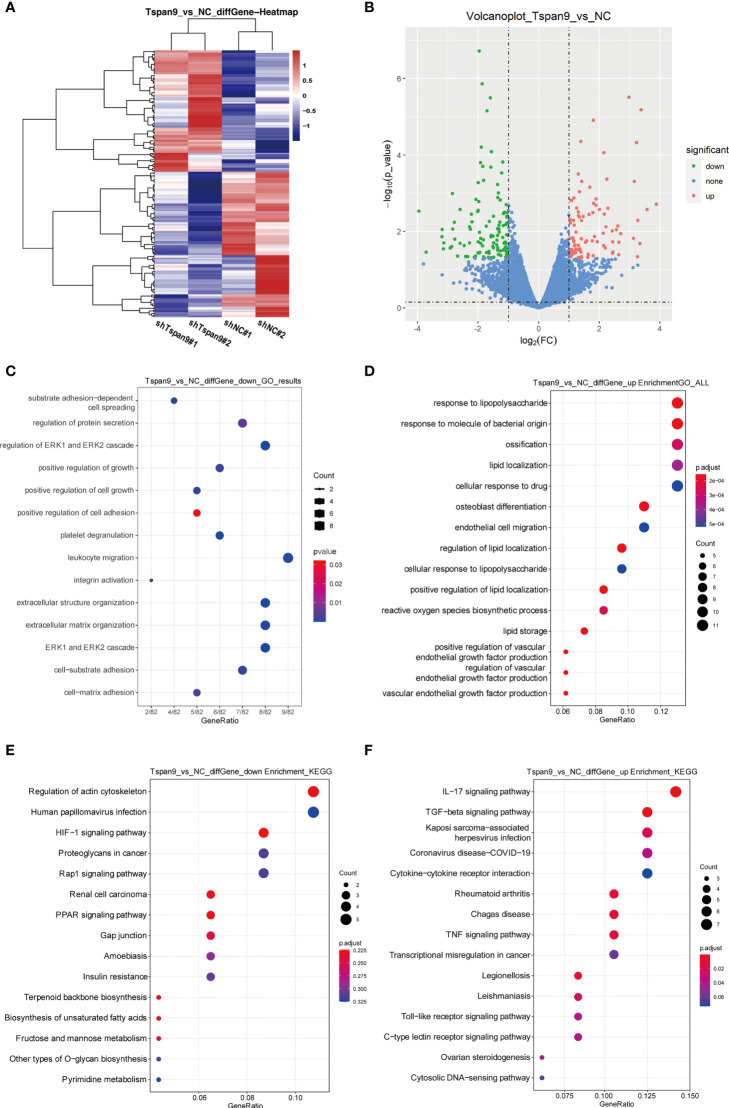
Figure 3.
RNA-seq-mediated identification of the biological roles of Tspan9 in OS cells. (A) Heatmaps demonstrating DEGs identified via RNA-seq in HOS cells in which shTspan9 or shNC were stably expressed. (B) DEGs (n=211) are represented in a volcano plot, including 96 upregulated DEGs (red) and 115 downregulated DEGs (green), with DEGs having been identified using the following criteria: adjusted log fold-change ≥ 1 and P ≤ 0.05. (C, D) GO analyses of DEGs identified following Tspan9 knockdown were conducted, with top enriched biological processes, molecular functions, and cellular components being shown in a bubble chart in which darker coloration is indicative of more significant enrichment. (E, F) KEGG pathway enrichment analyses of identified DEGs were conducted, with the results being shown in a bubble chart in which bubble size is proportional to the number of DEGs in a given pathway, and the bubble color is indicative of P-value significance (red = significant, blue = non-significant). DEGs, differentially expressed genes; GO, Gene Ontology; KEGG, Kyoto Encyclopedia of Genes and Genomes.

