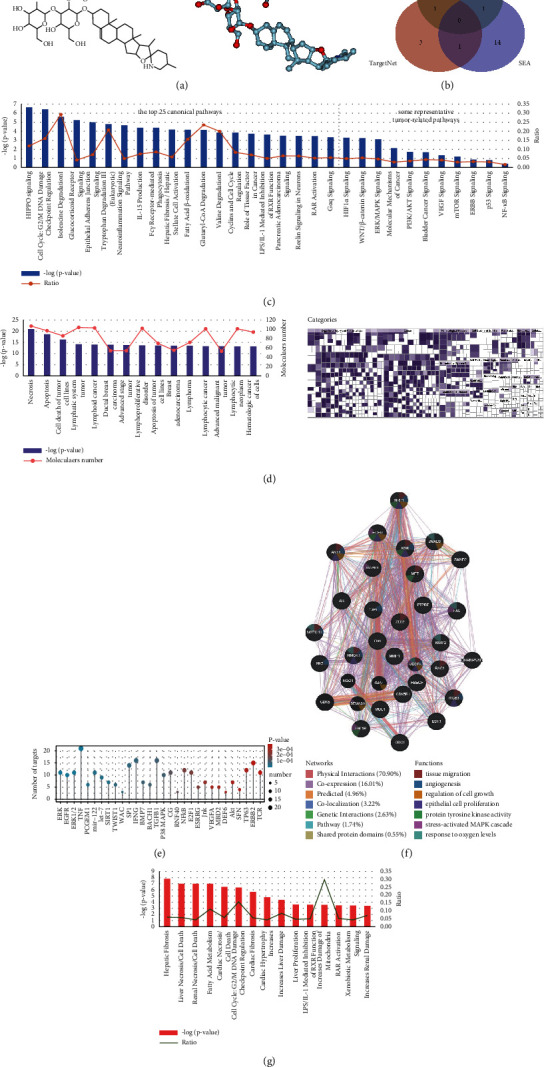
Figure 1.

Bioinformatics analysis of potential targets of solasonine using IPA. (a) 2D and 3D molecular structures of solasonine. (b) Venn graph showing overlapping and specific genes predicted from PharmMapper, TargetNet, and SEA databases. (c) Canonical pathway analysis of solasonine by IPA. The top 25 enriched canonical pathways and some representative tumor-related pathways, sorted by −log(P-value) in decreasing order, are shown. (d) Disease and functional analysis using IPA for solasonine. The bar graph shows the top 15 annotations, and the heatmap shows the enrichment of targeting genes enriched in disease and function categories. (e) Upstream analysis using IPA for solasonine, showing the upstream regulatory factors for potential target genes of solasonine. The top 30 upstream regulatory factors in decreasing order of P-value were shown. (f) Causal regulatory network associated with NRP1. NRP1 was predicted as a master regulator involved in the regulation of 7 upstream regulators, including ERK (group), EGFR, AKT, KDR, MET, SMAD2, SMAD3. (g) Toxicity analysis for solasonine shows the top 15 potential toxicities.
