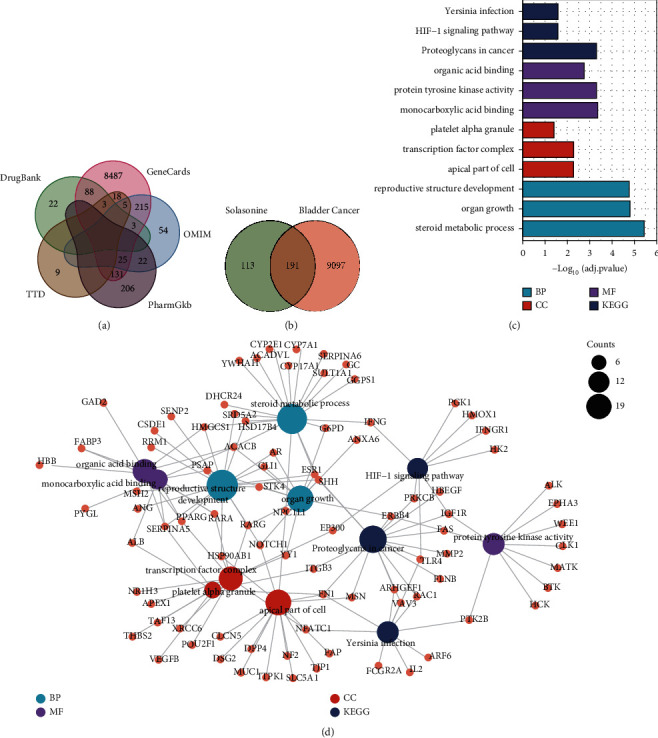
Figure 2.

Target identification and functional enrichment analysis of potential target genes of solanine in bladder cancer. (a) Venn graph showing the overlapping and specific genes associated with BC in GeneCards, OMIM, TTD, PharmGKB, and DrugBank databases. (b) Venn graph showing the overlapping and specific genes by integration of the potential targets regulated by solasonine and genes associated with BC. (c) Bar graph showing the top three significantly enriched KEGG pathways and GO terms (BP, CC, and MF), sorted by adjusted P-values in increasing order. (d) Gene-pathway/GO terms network showing interactions among gene targets for solasonine and the top significant enriched pathways/GO terms.
