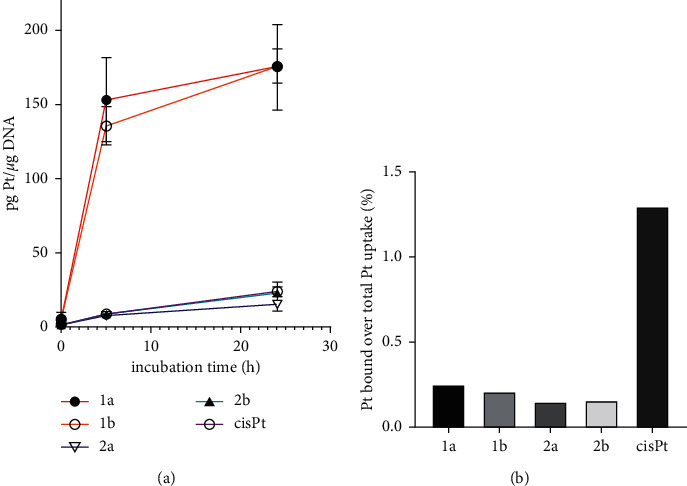
Figure 5.

(a) DNA platination in MDA-MB-231 cells treated for 5 and 24 h at 10 µM concentrations of Pt(II) complexes. All results are expressed as the mean ± SD from three independent experiments. (b) The percentage of Pt bound to DNA over the total Pt taken up to MDA-MB-231 cells (5 h incubation).
