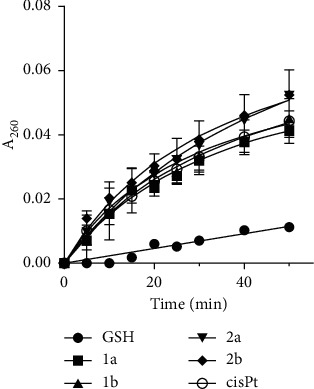
Figure 6.

UV absorbance associated with the reaction of complexes 1a, 1b, 2a, 2b, and cisplatin with GSH. Absorbance at 260 nm is shown as a function of time. The curves represent absorbances of the solution containing platinum complex plus GSH, from which the absorbance yielded by the Pt complex and GSH at t = 0 was subtracted. All results are expressed as the mean ± SD from two independent experiments, each performed in triplicate.
