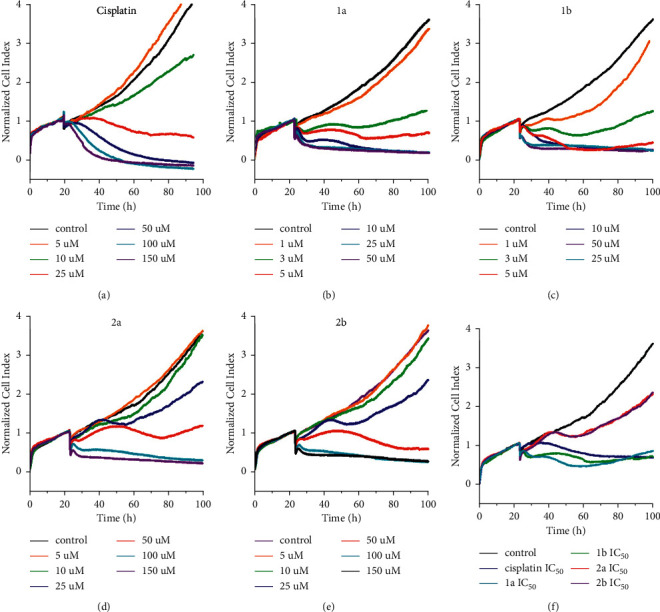
Figure 7.

Interaction of MDA-MB-231 cells with cisplatin (a), 1a (b), 1b (c), 2a (d), and 2b (e) monitored by a real-time cell analyzer (RTCA). (f) A comparison of RTCA profiles was found for 1a, 1b, 2a, 2b and cisplatin at their equitoxic concentrations (IC50,72h). The vertical lines indicate the start of the treatment after allowing the cells to adhere to microelectrodes and grow for 24 h. Cell indices were normalized to account for differences in cell counts that existed across the wells before the treatment. Incubations were performed in triplicate with 3000 cells per well.
