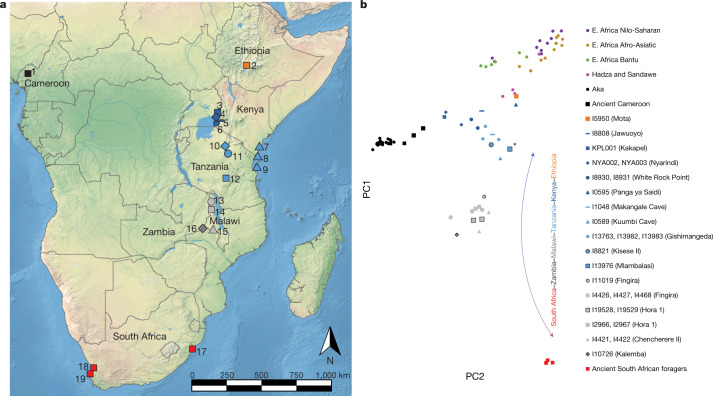
Fig. 1. Locations of the individuals analysed and PCA analysis.
a, Locations of individuals analysed in this study. The shapes and colours of the symbols correspond to the PCA in b. 1, Shum Laka; 2, Mota Cave; 3, Kakapel RS (Rockshelter); 4, Nyarindi RS; 5, Jawuoyo RS; 6, White Rock Point; 7, Panga ya Saidi; 8, Makangale Cave; 9, Kuumbi Cave; 10, Gishimangeda Cave; 11, Kisese II RS; 12, Mlambalasi RS; 13, Fingira; 14, Hora 1; 15, Chencherere II; 16, Kalemba RS; 17, Ballito Bay; 18, Faraoskop RS; 19, St Helena. b, PCA results. Axes were computed using present-day groups from eastern (Dinka pastoralists), southern (Juǀ'hoansi foragers) and central Africa (Mbuti foragers). Small circles represent present-day individuals; other symbols represent ancient individuals (larger points corresponding to earlier individuals and black outlines to newly reported individuals). The lowest-coverage individual (from Mlambalasi), shown with an asterisk, has the most uncertain position. The base map in a is from Natural Earth (https://www.naturalearthdata.com). E., east.

