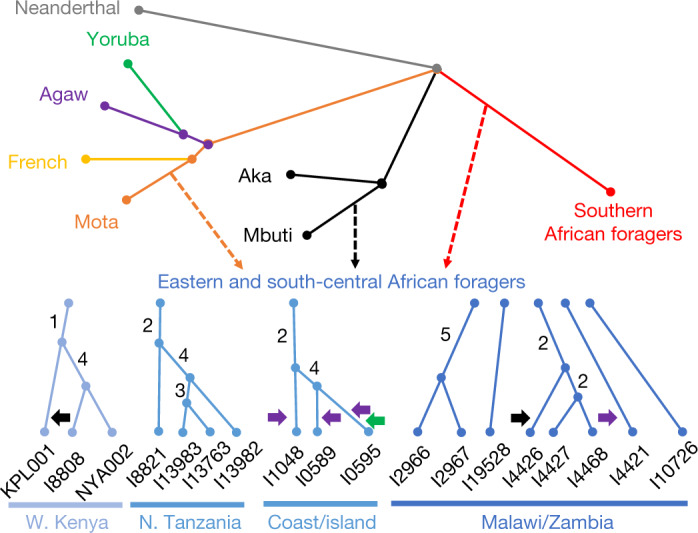
Fig. 2. Schematic of admixture graph results.

Branch lengths are not to scale. The arrows denote admixture events, with the three primary components of ancestry shown as dashed arrows, and other inferred gene flow as small solid arrows (with colours corresponding to related groups). Subclusters of ancient eastern and south-central African foragers reflect the inferred instances of excess relatedness among individuals, with internal branch lengths shown in genetic-drift units. Mixture proportions are shown in Fig. 3 and Supplementary Table 9 and the full results are shown in Extended Data Fig. 4. Individual laboratory numbers are shown at the bottom (Extended Data Table 1). N., north; W., west.
