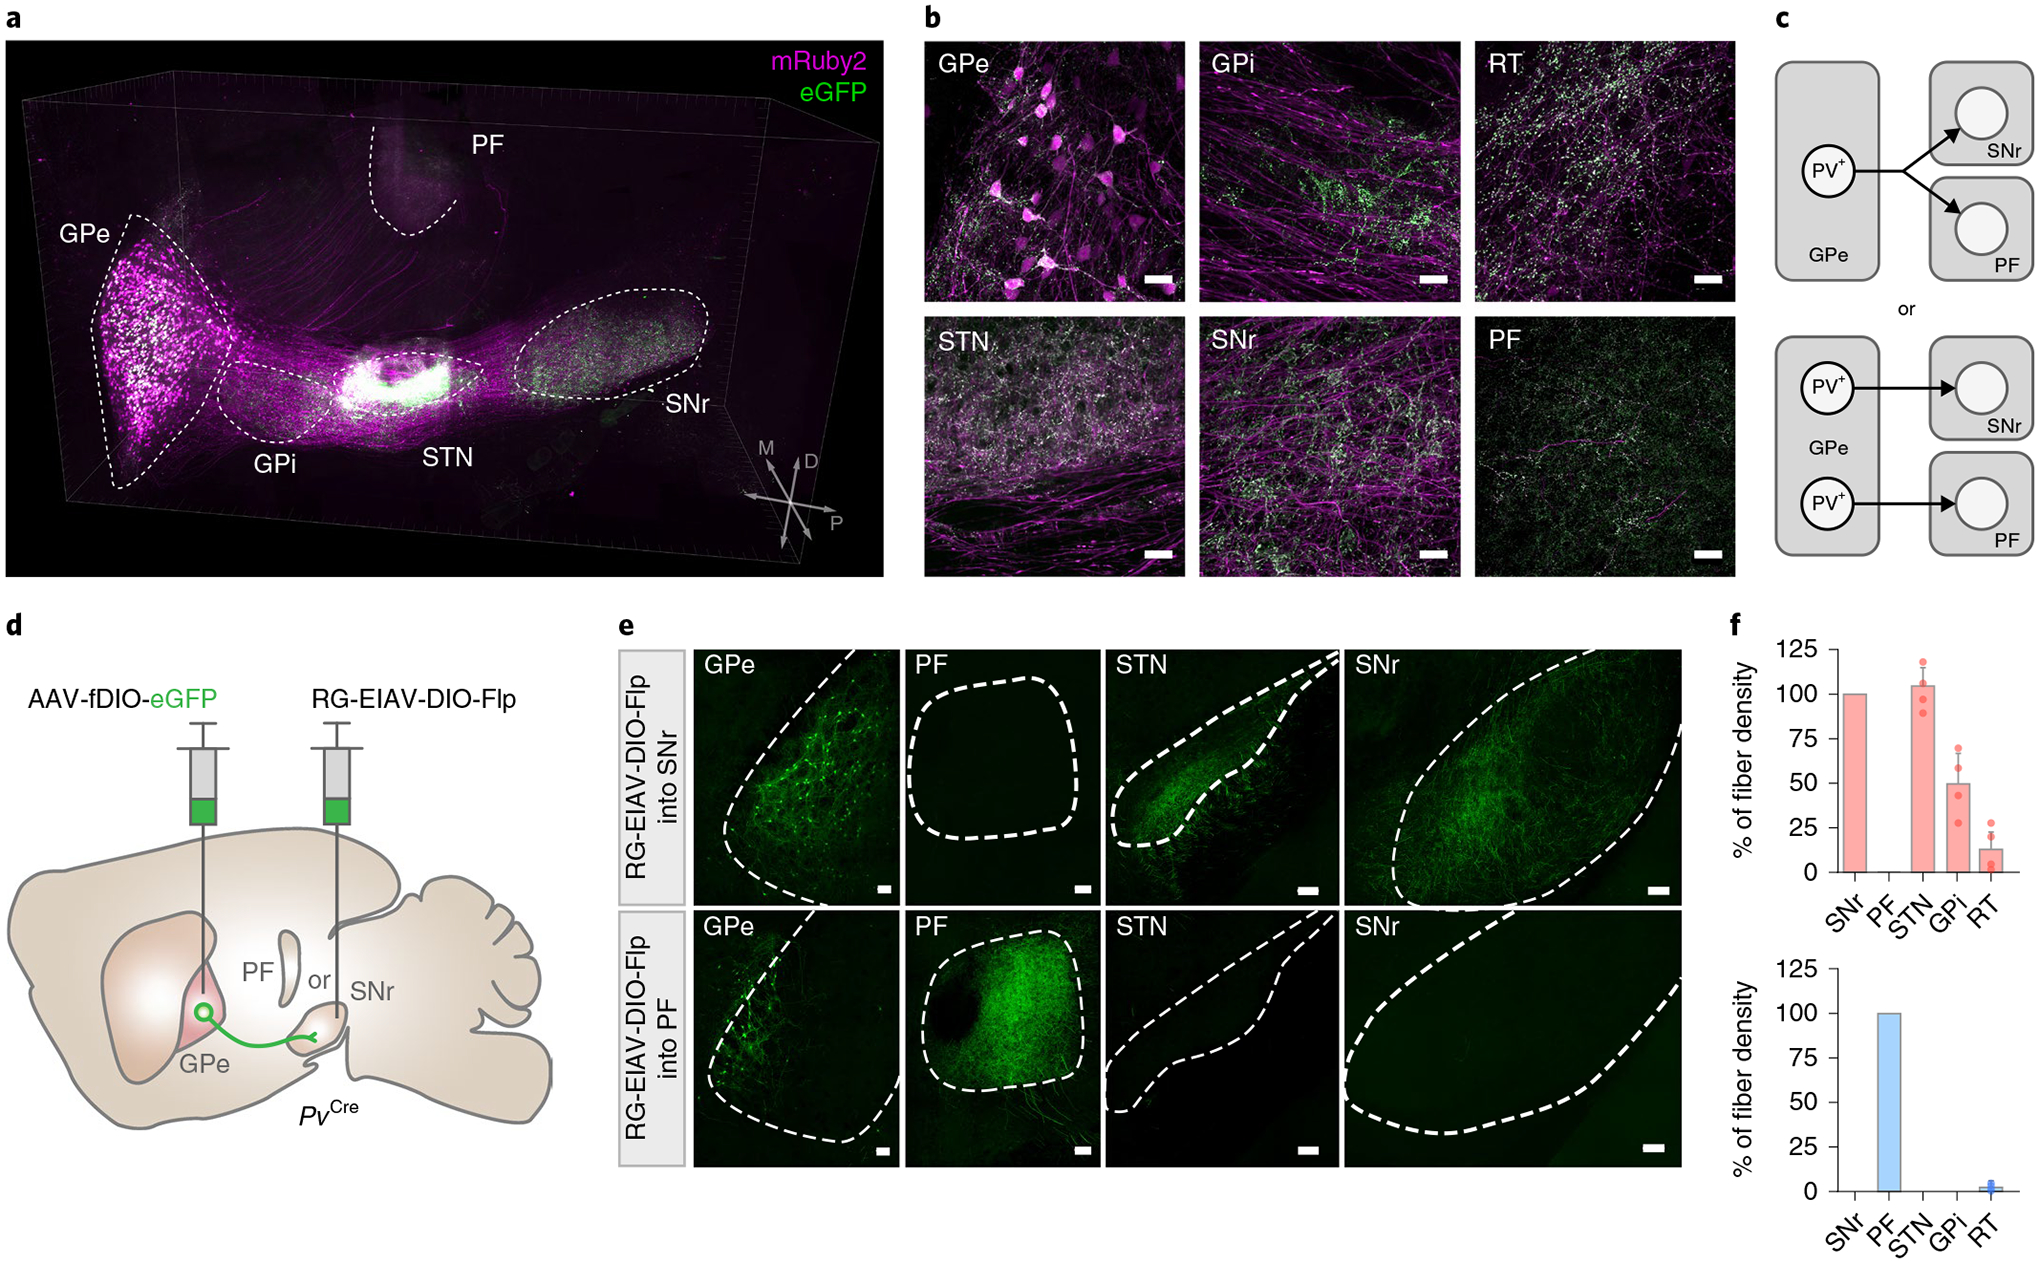
Fig. 1 |. Distinct subpopulations of GPe-PV neurons project to the SNr and PF.

a, Three-dimensional rendering of a cleared mouse hemisphere showing brain-wide projection patterns of GPe-PV neurons labeled by mruby2 (soma, axonal fibers) and eGFP (pre-synaptic sites). b, representative confocal images of the injection site in GPe (top left) and target structures showing axonal fibers in magenta and synaptic puncta in green (repeated in n = 4 mice). Scale bar, 30 μm. c, Two possible projection patterns: GPe-PV neurons collateralize to multiple targets (left) or individual neurons project to distinct targets (right). d, Schematic of viral strategy using a pseudotyped equine infectious anemia lentivirus capable of neuron-specific retrograde infection (rG-EIAV). SNr or PF of PvCre mice is injected with rG-EIAV that expresses Flp recombinase in a Cre-dependent manner (rG-EIAV-DIO-Flp) and the GPe is injected with an AAV that expresses eGFP in a Flp-dependent manner (AAV-fDIO-eGFP). e, Confocal images of SNr- and PF-projecting GPe-PV neurons and their axons (repeated in n = 4 mice for each target area). Scale bar, 100 μm. f, The quantification of the axonal fibers of PVGPe-SNr neurons (top; n = 4 mice) and PVGPe-PF neurons (bottom; n = 4 mice) in projected areas measured by the fluorescent intensity. Data are presented as % mean ± s.e.m. of control sections.
