
Extended Data Fig. 4 |. Structure of the reversal-learning task and comparison of overall neural activity during trials and inter-trial intervals.
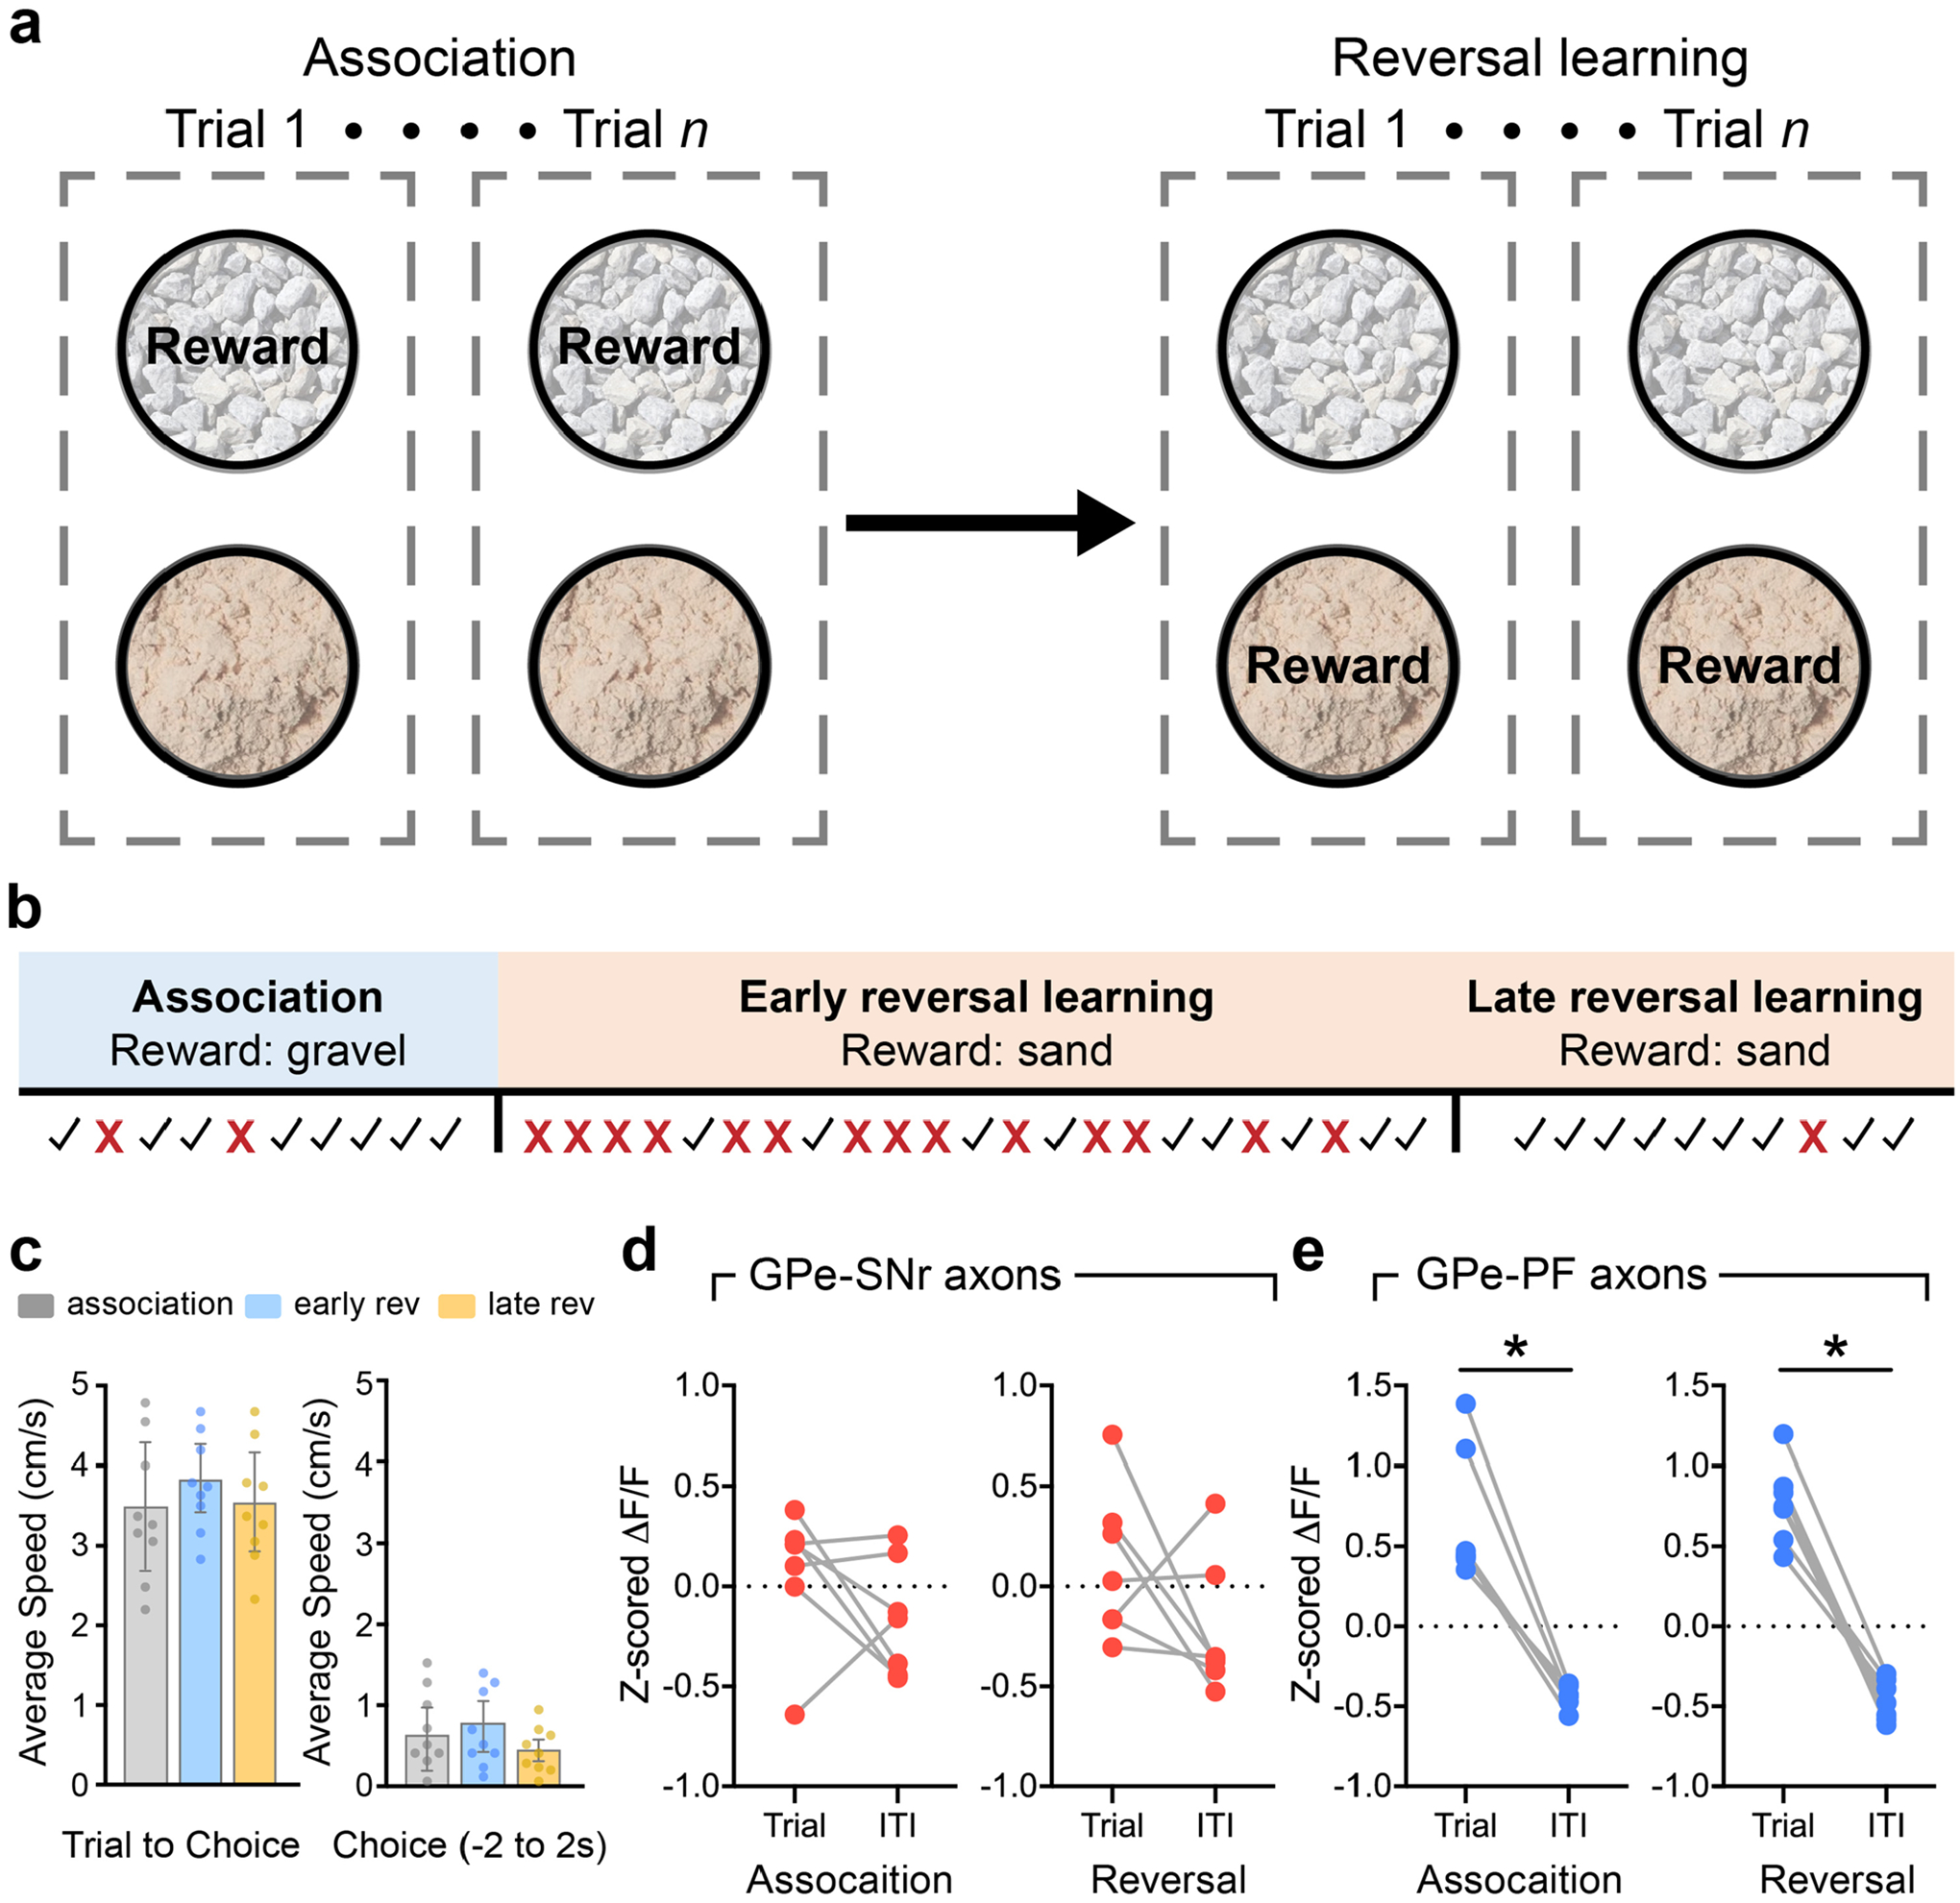
a, Example task structure using gravel and sand as digging media to provided two different contexts. The food reward is paired with sand in the association phase and is later switched to gravel in the reversal-learning phase. b, Timeline of the task showing how the association, early, and late reversal-learning stages are defined for a representative mouse. Check marks and crosses represent correct and incorrect trials, respectively. c, Average speed of animals across different stages of the reversal learning task. Note that no significant difference in locomotion was observed at different stages of the task. (Left: Duration of Trial to Choice, n = 9 mice, One-way ANOVA, F(2, 24) = 0.4743, p = 0.6280; right: Duration of Choice, n = 9, One-way ANOVA, F(2, 24) = 0.7019, p = 0.5055). All data presented as mean ± SEM. d, Comparison of mean z-scored ΔF/F for PVGPe-SNr axons between trial periods and inter-trial intervals (ITI) during the association phase (left; Wilcoxon sign-rank test, W = −12; p = 0.3750, n = 7 mice) and reversal-learning phase (right; Wilcoxon sign rank test, W = −18; p = 0.1562, n = 7 mice). e, same as in d, but for PVGPe-PF axons during the association phase (left; Wilcoxon sign-rank test, W = −28; *p = 0.0156, n = 7 mice) and reversal-learning phase (right; Wilcoxon sign rank test, W = −28; *p = 0.0156, n = 7 mice).