
Fig. 6 |. PVGPe-SNr and PVGPe-PF neurons exhibit distinct electrophysiological adaptations to dopamine depletion.
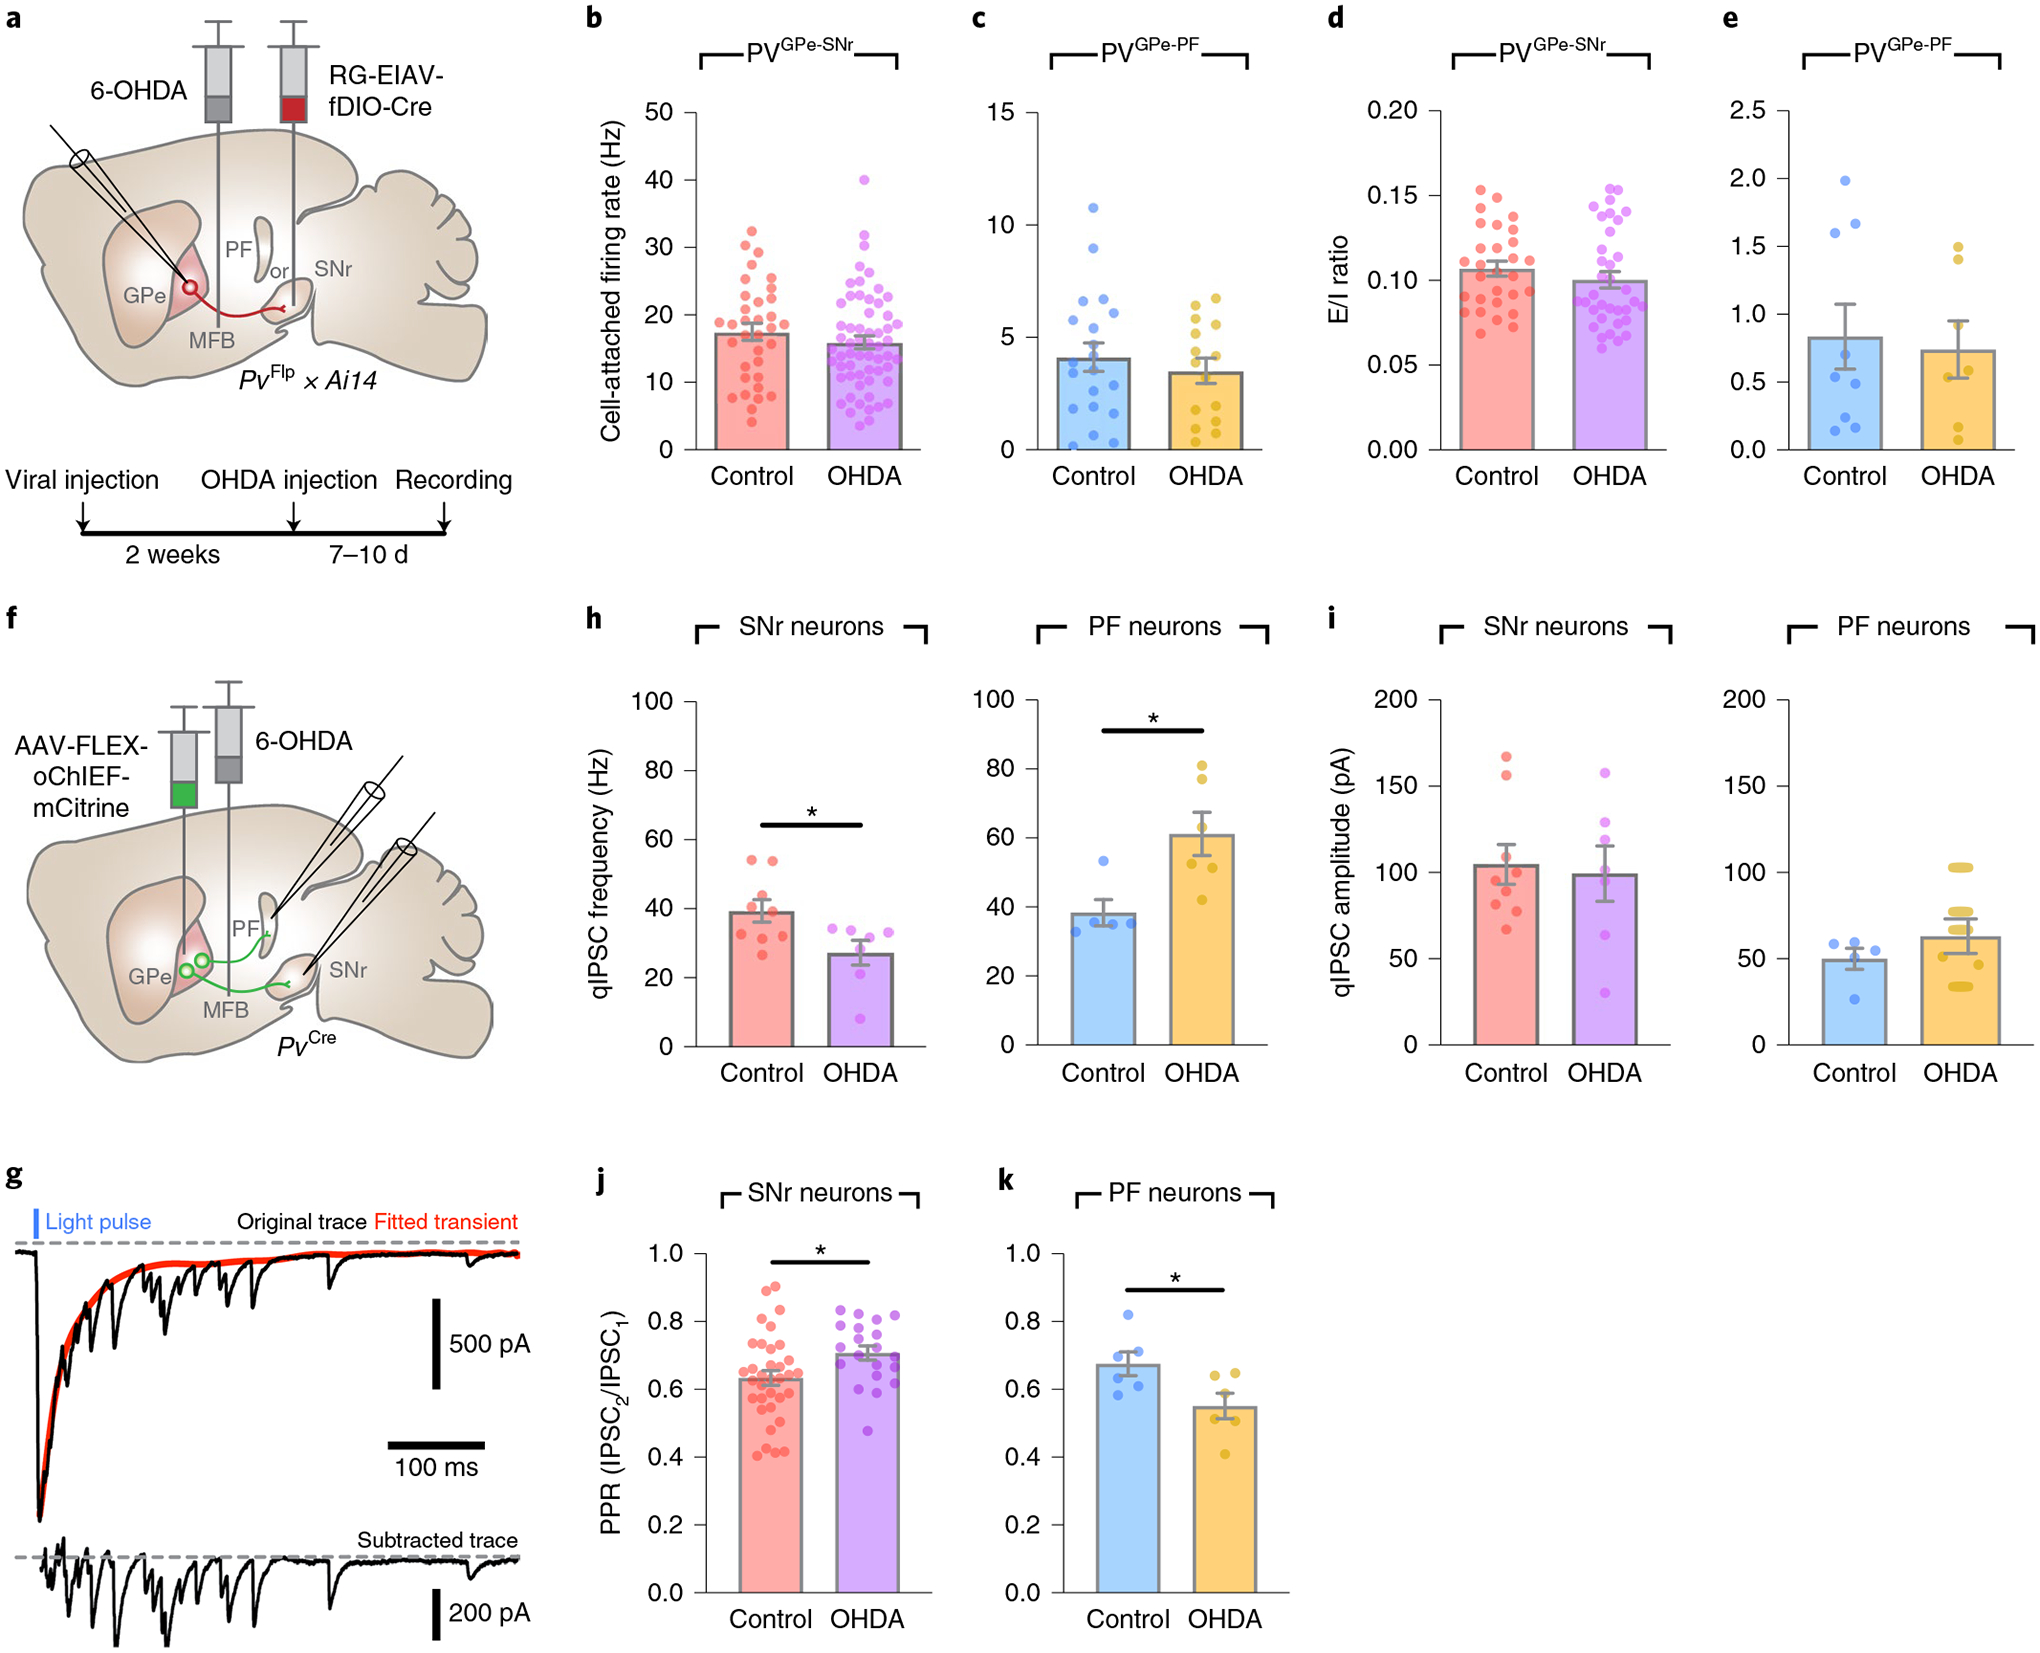
a, Schematic of viral and 6-OHDA injections and the experimental timeline for the recording of PVGPe-SNr and PVGPe-PF neurons in acute slices after dopamine depletion. b,c, Autonomous firing rate in PVGPe-SNr neurons (b; control n = 34 cells from nine mice, OHDA n = 59 cells from 12 mice) and PVGPe-PF neurons (c; control n = 20 cells from eight mice, OHDA n = 15 cells from seven mice) recorded in cell-attached configuration in the presence of synaptic transmission blockers, NBQX and PTX in extracellular solution. Mann–Whitney U test, U = 849, P = 0.2213 in b and U = 139, P = 0.7297 in c. d,e, E/I ratio onto PVGPe-SNr neurons (d; control n = 29, OHDA n = 35 cells) and PVGPe-PF neurons (e; control n = 7, OHDA n = 9 cells) from naive control and dopamine-depleted mice. Mann–Whitney U test, U = 419, P = 0.2371 in d and U = 29, P = 0.8371 in e. f, Schematic of viral and 6-OHDA injections for measuring qIPSCs in acute slices after dopamine depletion while photostimulating PVGPe-SNr and PVGPe-PF axons. g, Example trace (top) showing qIPSCs in SNr neurons elicited by photostimulation of GPe-PV terminals. red trace represents a fitted curve generated by Python script. qIPSC amplitudes were measured from subtracted trace (bottom) from 0–400 ms after stimulation. h, Frequency of optically evoked qIPSCs was decreased and increased in when recorded from SNr and PF neurons, respectively. Unpaired t-test, t(14) = 2.485, *P = 0.0262 for SNr and t(9) = 2.947, *P = 0.0163 for PF (SNr control n = 9 cells from three mice, SNr OHDA n = 7 cells from three mice; PF control n = 5 cells from two mice, PF OHDA n = 6 cells from two mice). i, Amplitudes of optically evoked qIPSCs in SNr and PF neurons were not altered by dopamine depletion. Unpaired t-test, t(14) = 0.2773, P = 0.7856 for SNr and t(9) = 1.052, *P = 0.3204 for PF (SNr control n = 9 cells, SNr OHDA n = 7 cells; PF control n = 5 cells, PF OHDA n = 6 cells). j,k, PPr (second IPSC peak/first IPSC peak amplitude) measured from SNr neurons (j; control n = 34 cells from eight mice, OHDA n = 20 cells from six mice) and PF neurons (k; control n = 6 cells from three mice, OHDA n = 6 cells from four mice) of naive control and dopamine-depleted mice. Unpaired t-test, t(52) = 2.244, *P = 0.0291 in j and t(10) = 2.418, *P = 0.0362 in k. All data are presented as mean ± s.e.m.