
Extended Data Fig. 2 |. Controls for fiber photometry recordings.
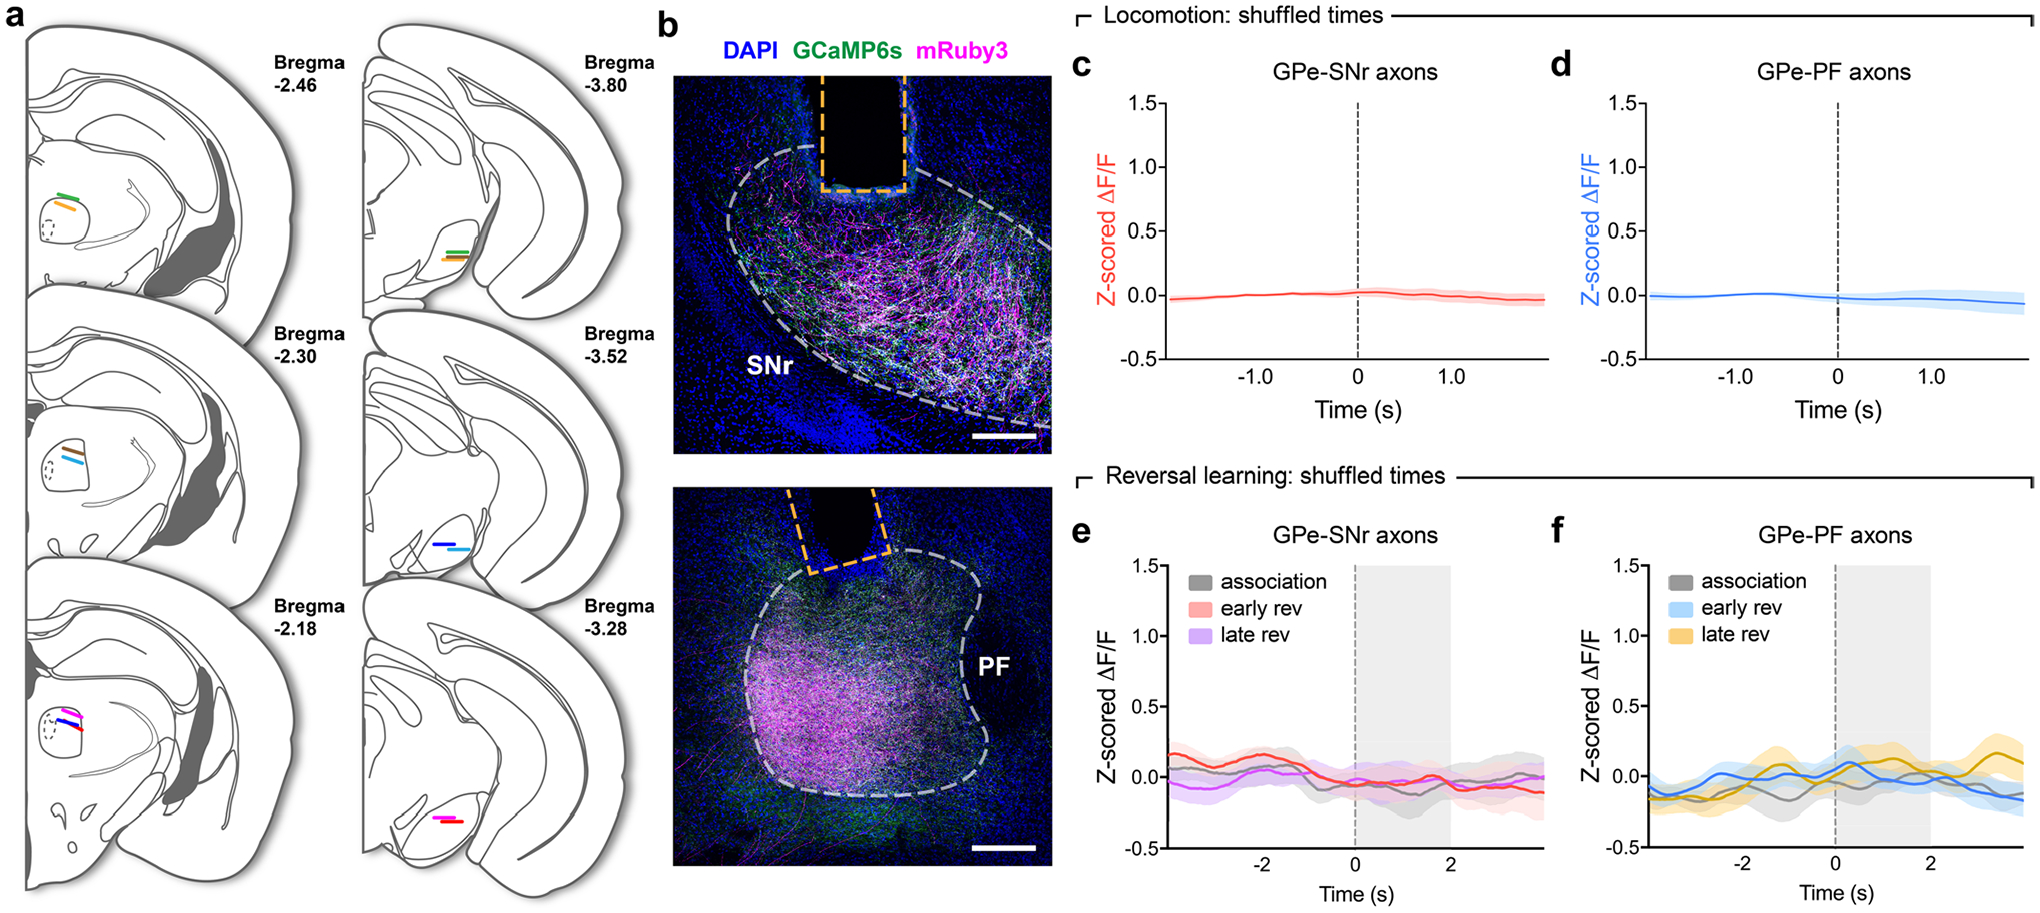
a, Optic fiber placements in PF and SNr for fiber photometry recordings. Different colors denote fibers from the same mouse (n = 7 mice). b, representative images from n = 7 mice used in photometry recordings showing mruby3 and axon-GCaMP6s expression in axons of GPe-PV neurons at implantation sites for optic fibers. Scale bars, 200 μm. c, Z-scored ΔF/F (averaged across all events) representing the activity of PVGPe-SNr axons at randomly chosen time points during treadmill locomotion. Number of events was determined based on the number of locomotion onsets in each recording session (n = 135 events). d, same as in c, but showing the activity of PVGPe-PF axons. e, Z-scored ΔF/F (averaged across 7 mice) representing the activity of PVGPe-SNr axons at randomly chosen time points during different stages of reversal-learning task. Number of events was determined based on the number of trials in each stage of the task. f, same as in e, but showing the activity of PVGPe-PF axons. Shaded areas accompanying the z-scored ΔF/F traces in c-f indicate SEM.