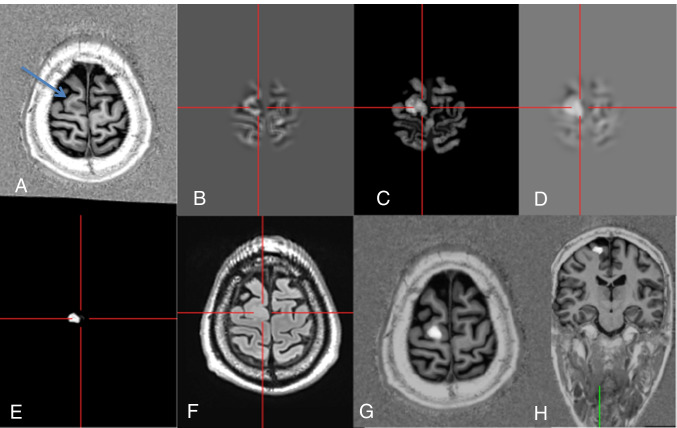
Fig. 1.
Axial MP2RAGE image with a FCD IIB of the right superior frontal gyrus (A: arrow). Postprocessing with normalization, segmentation, and subtraction/division from a database with 154 healthy controls results in the calculation of junction (B), thickness (C), and extension images (D). These serve among others as input maps for an ANN that creates binary output maps in which the lesion is displayed in gray tones (E). An axial FLAIR image helps to separate the FCD and false positives (F). At the end, co-registered output and MP2RAGE maps are inversely normalized and sent back to the PACS system, in which they are viewed by scrolling through the co-registered data set (G, H) (#12)

