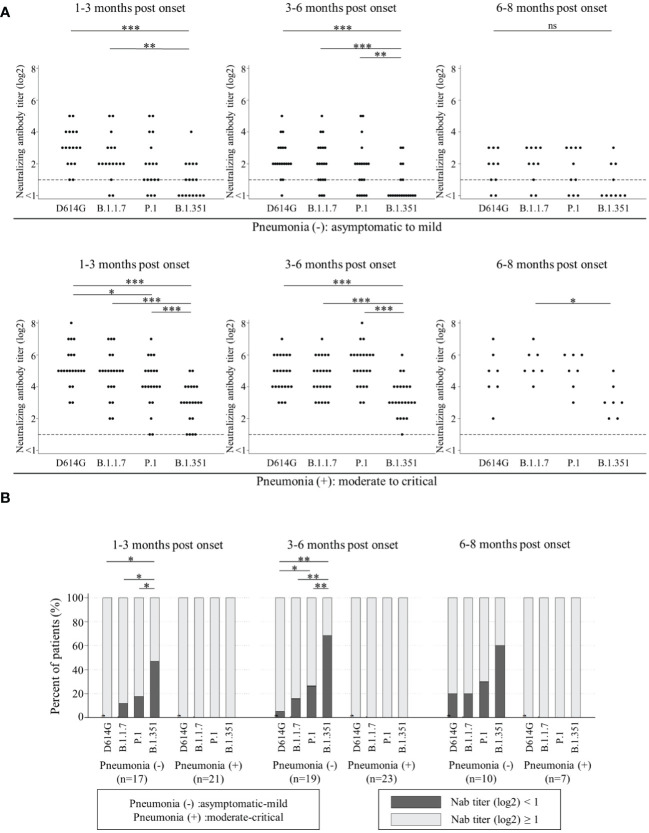
Figure 2.
Comparisons of neutralizing antibody titers among D614G and three VOCs by the timing of sampling in ‘patients without pneumonia’ [1-3 months post onset (n=17), 3-6 months post onset (n=19), and 6-8 months post onset (n=10)] and those in ‘patients with pneumonia’ [1-3 months post onset (n=21), 3-6 months post onset (n=23), and 6-8 months post onset (n=7)] are shown in (A). Vertical bars show the neutralizing antibody titer (log2). Horizontal bars show the four variants (D614G mutation, B.1.1.7, P.1, and B.1.351) by the three groups of months post-onset (1-3m, 3-6m, and 6-8m). Friedman’s test and Benjamini–Hochberg correction were performed to analyze both data. The dash line shows that neutralizing antibody titers (log2) is one, which is the cut-off point. Comparison of neutralizing titer under one (ND) among four variants are shown in (B). Vertical bars show the percentages of patients. Black shows the percentage of neutralizing antibody titers (log2) under one and grey shows that of more than one. Horizontal bars show the four variants (D614G mutation, B.1.1.7, P.1, and B.1.351) by the three sampling times. Cochran’s Q test and Benjamini–Hochberg correction were performed. The level of statistical significance was set at p < 0.05 (*p < 0.05; **p < 0.01; ***p < 0.001; and ns, not significant)).

