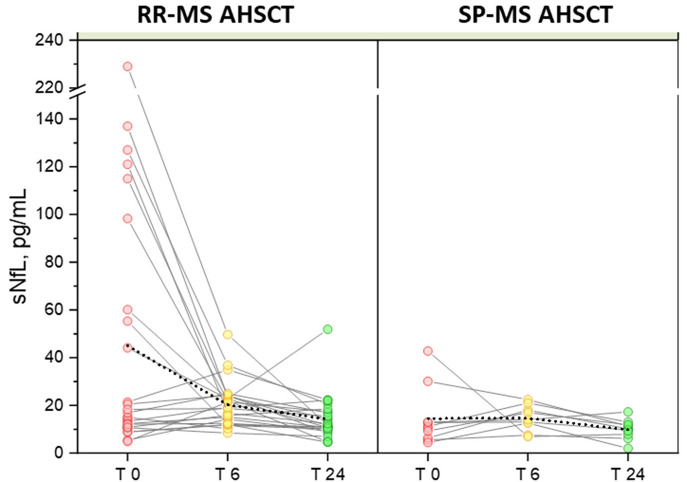
Figure 2.
Variation in serum NfL following AHSCT. Individual values of pre- and post-AHSCT sNfL for RR-MS (left) and SP-MS AHSCT patients (right) are connected with solid colour lines. Mean values of each group are connected with a dotted line, showing high sensitivity of the mean to the outliers with a significant reduction in the RR-MS group at months 6 (20.23 pg/mL) and 24 of follow-up (14.33 pg/mL) compared to baseline (45.06 pg/mL), p values 0.012 and 0.010 for month 6 and 24, respectively.

