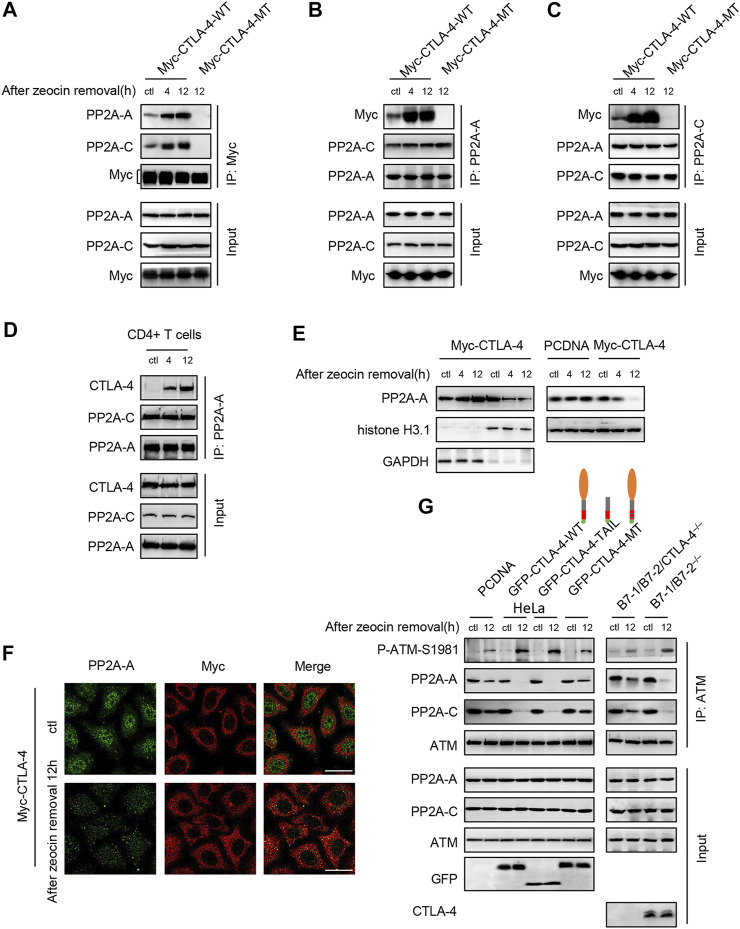
FIGURE 6.
CTLA-4 interacts with PP2A, promotes the translocation of PP2A-A into the cytoplasm, and induces autophosphorylation of ATM at Ser1981 after zeocin treatment. (A–C) Co-IP analysis of the interaction of CTLA-4 with PP2A. HeLa cells were transfected with Myc-CTLA-4-WT and Myc-CTLA-4-MT proteins with the Y201F and Y218F mutations. About 24 h after transfection, the cells were treated with 500 μg/ml zeocin for 1 h and harvested at the indicated times. (D) For endogenous co-immunoprecipitation experiments, CD4+ T cells from B7-1/B7-2−/− mice were lysed. (E) Nuclear and cytoplasmic levels of PP2A-A in HeLa cells were detected using western blotting. HeLa cells were transfected with Myc-CTLA-4 (left panel), and pcDNA and Myc-CTLA-4 (right panel) for 24 h. At the indicated times after cessation of treatment, the cells were lysed and separated into nuclear and cytosolic fractions. GAPDH, a marker of the cytosolic fraction; histone H3.1, a marker of the nuclear fraction. (F) Double immunofluorescence staining was performed to detect the PP2A-A and CTLA-4 proteins and their colocalization in HeLa cells. HeLa cells were transfected with Myc-CTLA-4 for 24 h. The cells were treated with 500 μg/ml zeocin for 1 h, harvested at the indicated time points, and then subjected to immunofluorescence staining using specific antibodies against PP2A-A (green), CTLA-4 (red), and Scale bar, 20 μm. (G) ATM was immunoprecipitated and immunoblotted to detect the levels of P-ATM-S1981, total ATM, and the PP2A-A and PP2A-C subunits. Right panel: HeLa cells were transfected with pcDNA, GFP-CTLA-4-WT, a GFP-CTLA-4-TAIL (tail only) mutant, and GFP-CTLA-4-MT sequences containing Y201F and Y218F mutations. About 24 h after transfection, the cells were treated with 500 μg/ml zeocin for 1 h and harvested at the indicated time points. The CTLA-4 extracellular domain is shown as orange ovals, the transmembrane domain is indicated by gray bars, the CTLA-4 cytoplasmic tail is shown as red bars, the double-mutant Y201F/Y218 is shown with blue lines, and GFP is indicated by green circles. Left panel: CD4+ T cells from B7-1/B7-2−/− and B7-1/B7-2/CTLA-4−/− mice were treated with 500 μg/ml zeocin for 1 h and then released and harvested at the indicated time points.

