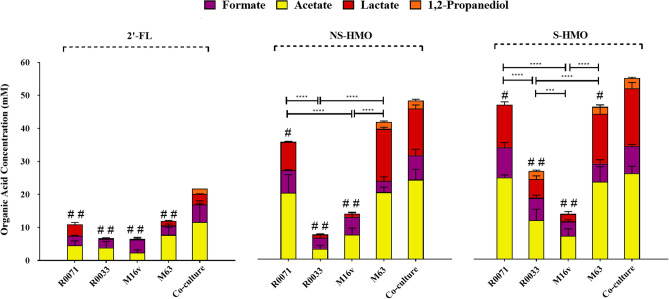
Figure 3.
Levels of organic acids and 1,2-propanediol (1,2-PD) produced after 10 h of growth of the bifidobacterial strains as mono-cultures and as a four strain co-culture. The following HMO were used as the sole carbon source: 2′-FL [1.2 g/L], model of NS-HMO [3.8 g/L] and a model of S-HMO [5 g/L]. Levels of acetic acid, formic acid, and lactic acid were quantified using HPLC coupled with an RI detector. Levels of 1,2-PD were quantified using GC–MS. R0071 = Bifidobacterium bifidum R0071, R0033 = Bifidobacterium infantis R0033, M-16V = Bifidobacterium breve M-16V, M-63 = Bifidobacterium infantis M-63. Analysis was calculated using technical duplicate data from biological triplicate experiments and data are means + /− SD. Univariate analysis of variance (ANOVA) and post-hoc Tukey tests were performed to determine the significant differences between the groups (# = p < 0.05, ## = p < 0.001 vs. co-culture) (* = p < 0.05, ** = p < 0.01, *** = p < 0.001, **** = p < 0.0001 between other strain combinations).

