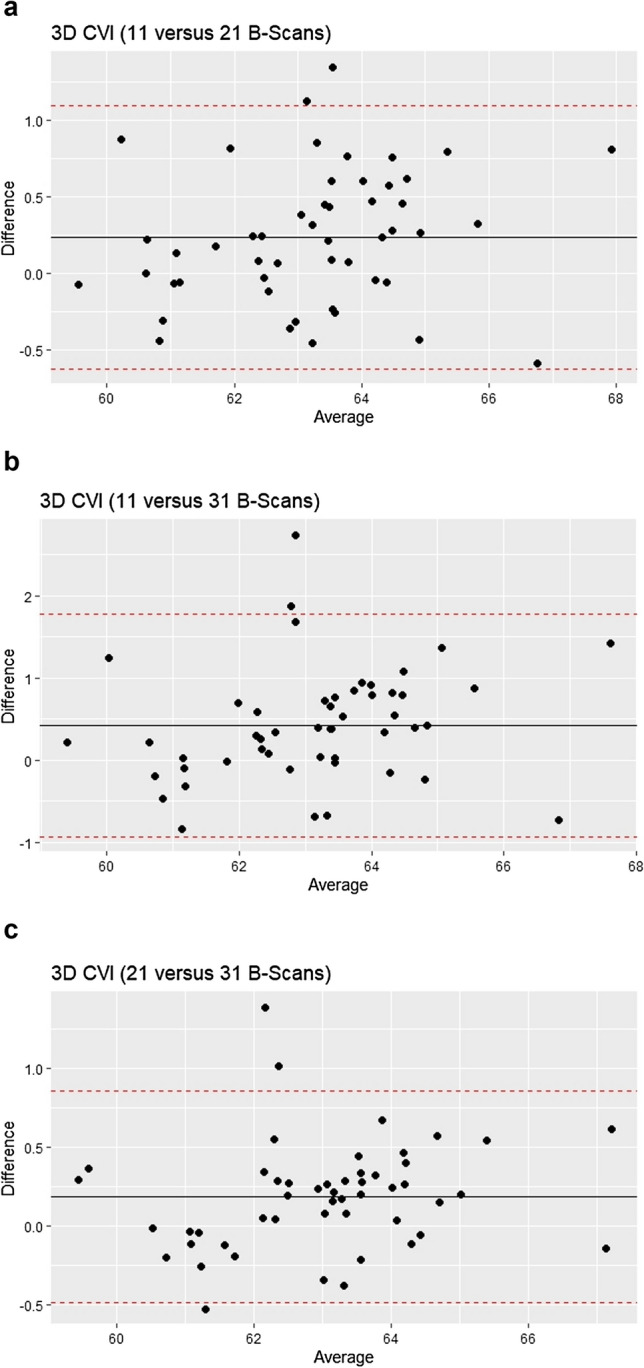
Figure 3.

a Bland–Altman analysis of 3D CVI (11 B-Scans) versus 3D CVI (21 B-scans). This is a plot of the difference [3D CVI (11 B-Scans)—3D CVI (21 B-Scans) versus the mean of the two measurements). b Bland–Altman analysis of 3D CVI (11 B-Scans) versus 3D CVI (31 B-scans). This is a plot of the difference [3D CVI (11 B-Scans)—3D CVI (31 B-Scans) versus the mean of the two measurements). c Bland–Altman analysis of 3D CVI (21 B-Scans) versus 3D CVI (31 B-scans). This is a plot of the difference [3D CVI (21 B-Scans)—3D CVI (31 B-Scans) versus the mean of the two measurements). The solid black lines represent the mean differences and the interrupted red lines represent the 95% limits of agreement.
