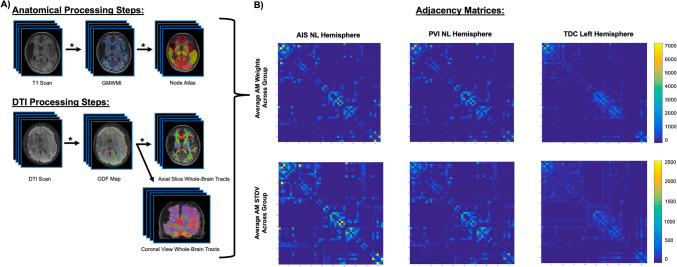
Figure 1.
Neuroimage processing steps. (A) Anatomical images were segmented based on tissue type and combined to create a gray matter-white matter interface (GMWMI) image. The AAL2 atlas (node atlas) was co-registered into patient diffusion space. For DTI images, eddy currents and small head motion was corrected. ODF maps were then generated and whole-brain tracts were reconstructed (restricted to only white matter using the GMWMI image) and seeded using the co-registered node atlas to generate an undirected 47 × 47 node adjacency matrix containing number of streamlines between node pairs (network weights). Network weights in the non-lesioned hemispheres were compared between groups of children with perinatal stroke (AIS, PVI) and the left hemisphere in controls. Asterisks highlight steps where quality assurance was performed by two authors. (B) Group average adjacency matrices for AIS, PVI and TDC participants as well as matrices containing standard deviations to visually illustrate variances between the groups. Images in (A) were generated using MRTrix3 (https://www.mrtrix.org/) and images in (B) were generated using MATLAB (https://www.mathworks.com/products/matlab.html). DTI diffusion tensor image, ODF orientation density function, AIS arterial ischemic stroke, PVI periventricular venous infarction, TDC typically developing controls.

