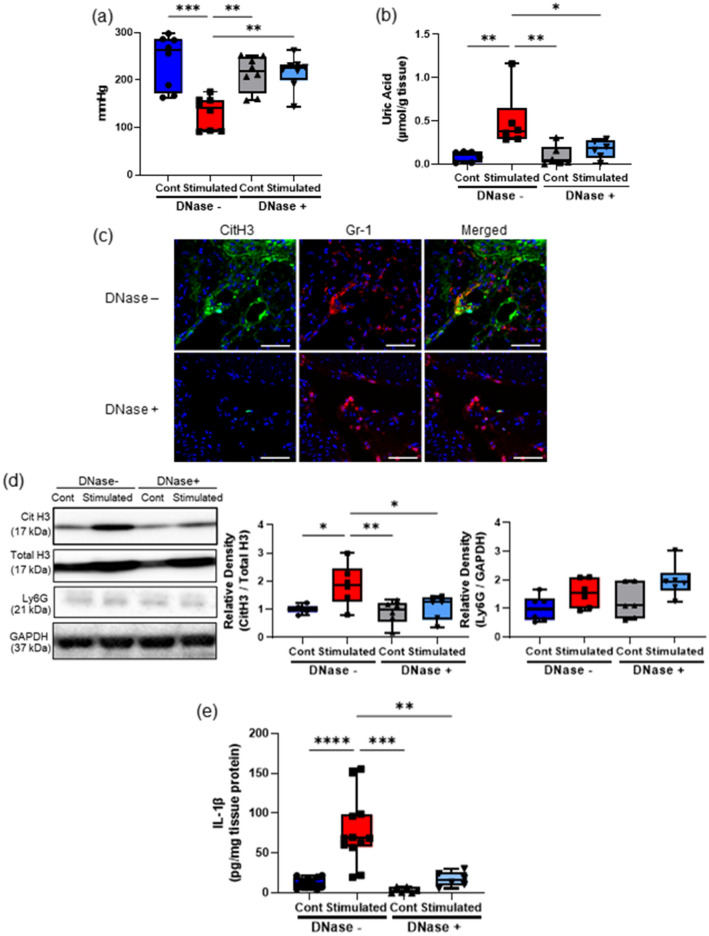
Figure 3.
Effects of DNase treatment on NETs induction associated with muscle hyperalgesia. The MNT values of hindlimbs (a n = 8 in each group) and the uric acid level (b n = 6 in each group) in the TSM tissues in sham-stimulated control and stimulated mice injected intravenously with 10 mg/kg/day of DNase I or a vehicle. (c) Representative IHC images (200 ×) of the stimulated TSM tissue with or without DNase I administration on day 7, indicating citH3 (green), Gr-1 (red), and DAPI (blue). Scale bar = 50 μm. Western blotting analysis of citH3 (d) and Ly6G amounts in TSM tissues on day 7 (n = 6 in each group). The relative density is normalized based on the loading control (total H3 and GAPDH). (e) ELISA analysis was performed to evaluate protein levels of IL-1β in TSM tissues on day 7 (n = 12 mice without DNase treatment, n = 6 mice with DNase treatment). All data are shown as Tukey’s boxplots with individual data points and analyzed using unpaired t-test for comparing the mean of two different samples or two-way ANOVA followed by post-hoc Tukey’s test for a comparison of more than two groups. Statistical significance is indicated with * (p < 0.05), ** (p < 0.01) and *** (p < 0.001), **** (p < 0.0001).

