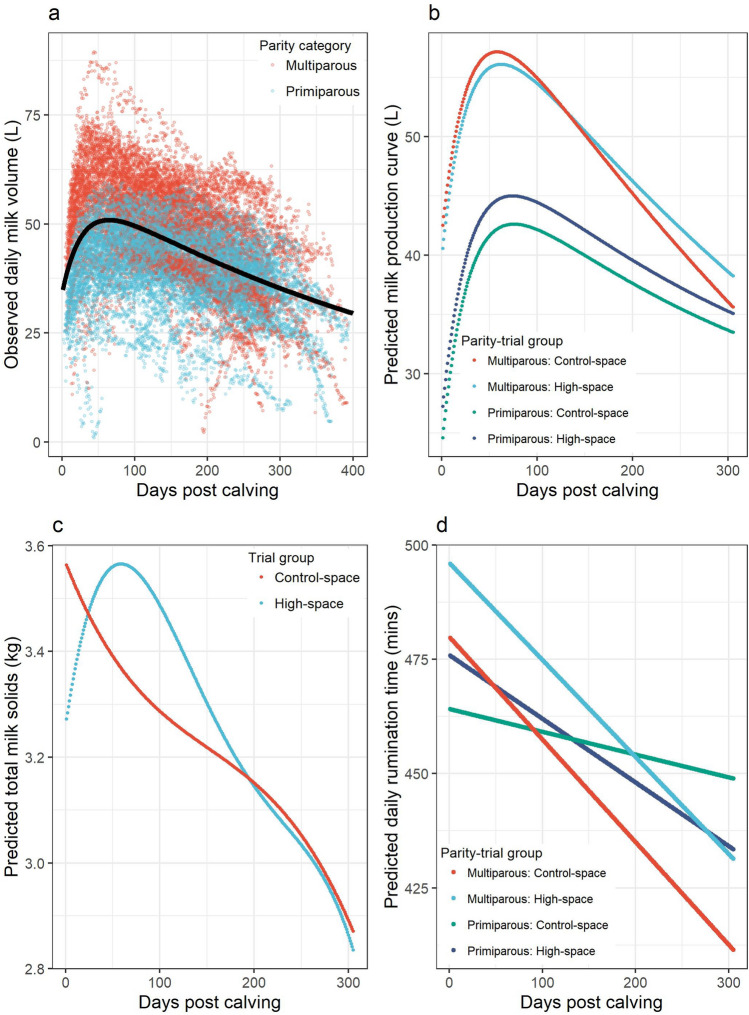
Figure 1.
Plots to illustrate the results of the production analysis, based on milk volume, milk solid and rumination data, for a randomised controlled trial assessing the impact of living space on housed dairy cows. (a) Scatterplot of daily milk yields in litres (y-axis) by days in milk (x-axis) for all cows (n = 150) throughout the randomised controlled trial period. The black line shows the non-linear model regression lactation curve prediction for all cows on trial. (b) Dot-plot depicting the predicted 305-day lactation curves using the parameters of the daily milk volume residual mixed effects model (Eq. 2) for the four groups of cows investigated: Primiparous—High-space (light blue); Primiparous—Control-space (green); Multiparous—High-space (red); Multiparous—Control-space (dark blue). (c) Plot to illustrate the predicted milk constituent curves from the mixed effects model parameters (Eq. 3) for the high (blue) and control (red) space groups. (d) Plot to illustrate the predicted rumination time using the mixed effects model estimates (Eq. 4) in minutes per day (y-axis) by days in milk (x-axis) for the four parity-trial groups investigated: Primiparous high-space (light blue); Primiparous control-space (green); Multiparous high-space (red); Multiparous control-space (dark blue).

