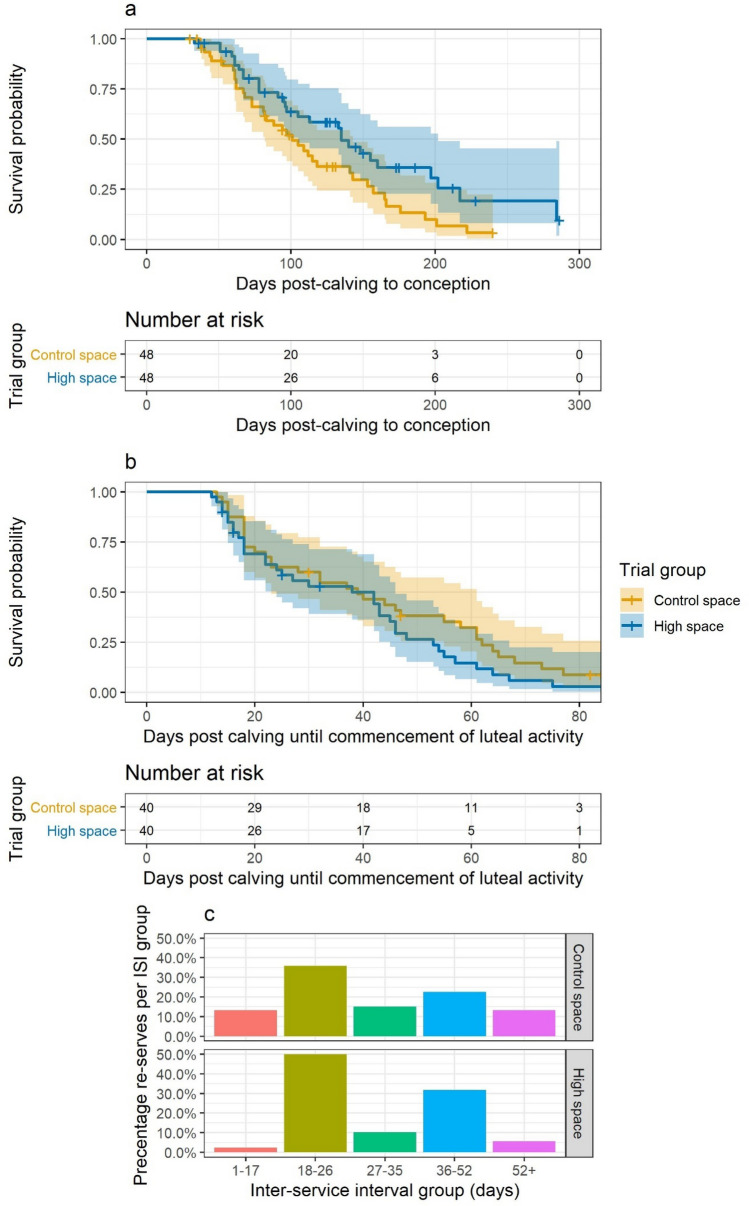
Figure 2.
Graphs based on fertility data analysed for a long-term randomised controlled trial which evaluate the impact of living space on housed dairy cows. (a) Results of time to conception analysis for matched cows that entered the trial non-pregnant (n = 48 pairs). Top: Kaplan–Meier plot of survival to conception for the high space (blue) and control space (yellow) trial groups. Respective colour shading represents the 95% confidence interval. Bottom: Risk table showing the associated number of cows non-pregnant at 0-, 100-, 200- and 300-days in milk (DIM) for each trial group. (b) Results of time to commencement of luteal activity (CLA) analysis (n = 40 pairs); colour shading represents 95% confidence interval as for (a). (c) Bar charts of inter-service intervals (ISI) by trial group (Top: control space; Bottom: high space). A higher percentage in the 18–26 day period (yellow bars) indicates normal cow cyclicity and provides a measure of the sensitivity of oestrous detection.

