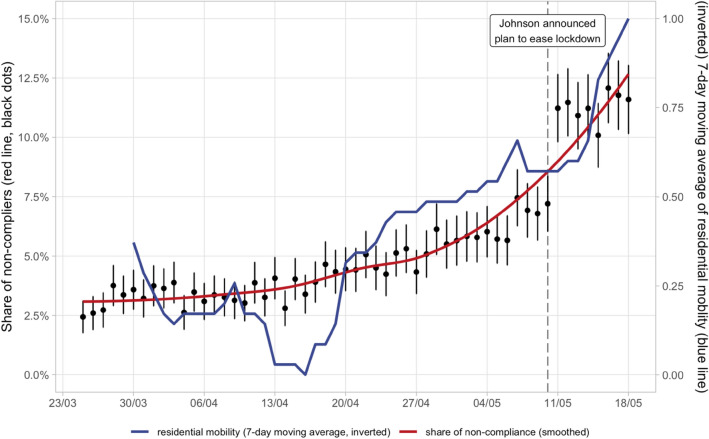
Figure 1.
The share of non-compliers steadily increasing from end of March until mid of May. On the 10th of May 2020, Prime Minister Johnson announced the government’s plan of exiting lockdown, which led to a significant jump of the share of non-compliers. The plot shows the average non-compliance shares for each day (black dots) with the corresponding 95% confidence intervals represented by the vertical lines (sample weights are applied). The red line is a smoothing function based on non-compliance averages from previous days. The blue line represents the (inverted and rescaled to a 0–1 range) 7-day-moving-average of the residential mobility indicator provided by Google. The minimum in the mobility index in mid-April 2020 referred to the time when Prime Minister Johnson was admitted to the St Thomas’ hospital in London. N = 105,512.

